Nila Kartika Wati
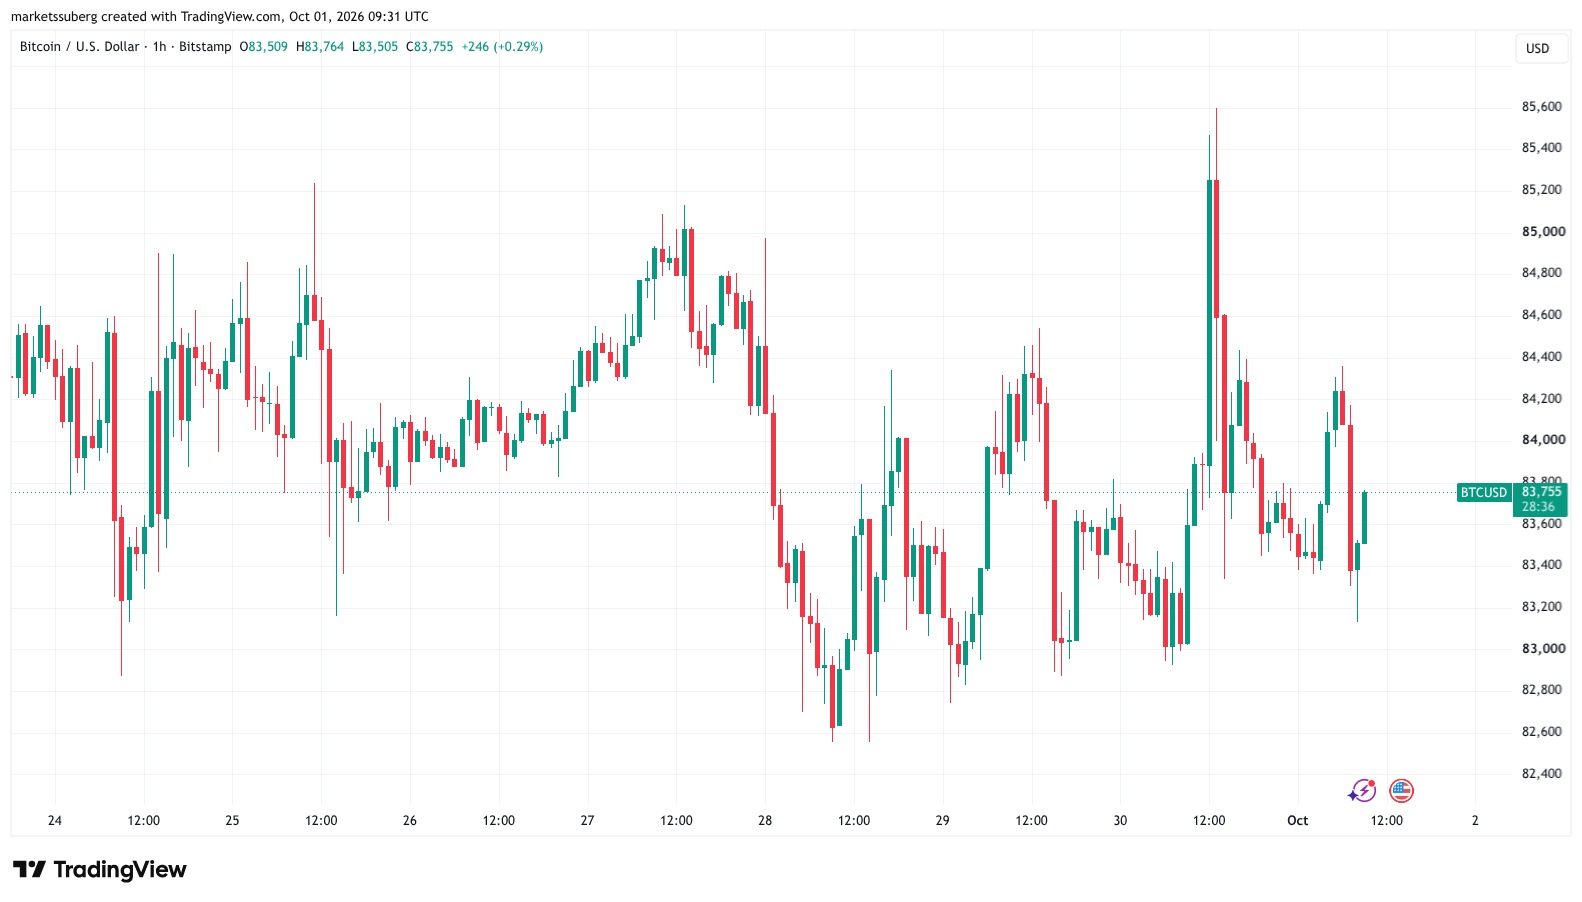
Bitcoin (BTC) has demonstrated a degree of resilience, maintaining its position above the $83,000 mark on Thursday, despite experiencing a reversal of earlier gains following the release of lower-than-anticipated U.S. inflation data. The cryptocurrency’s price movements underscore the intricate dance between macroeconomic indicators and the often-volatile digital asset market, especially as it transitions into the fourth quarter, a period historically favorable for Bitcoin.
PCE Data Release Triggers Brief Volatility
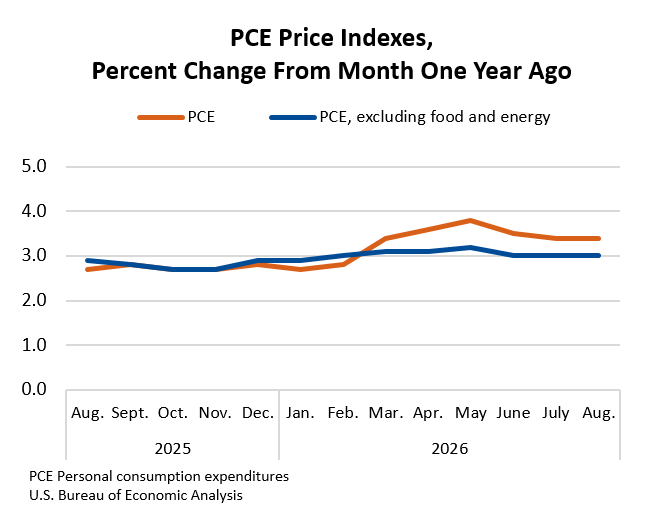
The primary catalyst for Bitcoin’s recent price action was the announcement of the Personal Consumption Expenditures (PCE) price index for August, which is the Federal Reserve’s preferred measure of inflation. The data, released by the Bureau of Economic Analysis (BEA), indicated that the PCE price index rose by 3.4% year-on-year, a figure that came in below market expectations of 3.7%. Core PCE, which strips out volatile food and energy components, increased by 3.0% from a year ago. This reading, lower than anticipated, initially sparked a brief rally in Bitcoin, pushing its price towards $85,600 before a subsequent retracement brought it back to current levels, illustrating a nuanced market reaction. Data from Coinbase showed BTC/USD trading relatively flat on the day after this bout of volatility.

The significance of the PCE index cannot be overstated in the current economic climate. Unlike the more commonly cited Consumer Price Index (CPI), the PCE index offers a broader measure of consumer spending and includes a wider range of goods and services, making it a more comprehensive gauge for policymakers at the Federal Reserve. A lower-than-expected inflation print typically signals a potential easing of inflationary pressures, which could, in theory, lead to a less aggressive monetary policy stance from the central bank. However, the market’s initial optimism proved short-lived for Bitcoin, suggesting other factors were at play, or that investors were scrutinizing the data more deeply.
Methodology Changes and Market Skepticism
Further complicating the interpretation of the August PCE figures were significant methodological changes incorporated into the report. The BEA’s release noted revisions affecting categories such as portfolio management and investment advice, computer software and accessories, and legal services. Market commentary publication The Kobeissi Letter highlighted these changes, suggesting that the revised methodology alone could have reduced Core PCE inflation by up to 20 basis points. Furthermore, The Kobeissi Letter pointed out that July’s headline and core PCE inflation figures had also been revised downward by 30 basis points. This context led Kobeissi to forecast that markets would "heavily discount" the August reading, implying a degree of skepticism regarding the true extent of disinflation.
This skepticism was reflected in the broader financial markets. On Wednesday, following the PCE release, the S&P 500 closed down 0.25% at 7,651 points, while the Dow Jones Industrial Average shed 0.86%. These movements suggest that while the headline inflation number might have appeared favorable, investors were cautious, perhaps anticipating that the Federal Reserve would look beyond a single data point, especially one influenced by methodological adjustments, when considering future interest rate decisions. The nuanced reaction underscores the complexity of interpreting economic data in real-time and its immediate impact on diverse asset classes, from traditional equities to digital currencies.
Federal Reserve Policy Outlook
The trajectory of U.S. monetary policy remains a dominant theme influencing global markets, including cryptocurrencies. The Federal Reserve’s stance on interest rates is primarily driven by its dual mandate of maximizing employment and maintaining price stability. While the August PCE data provided some evidence of cooling inflation, its reception by the market suggests that the path forward for the Fed is far from clear-cut.
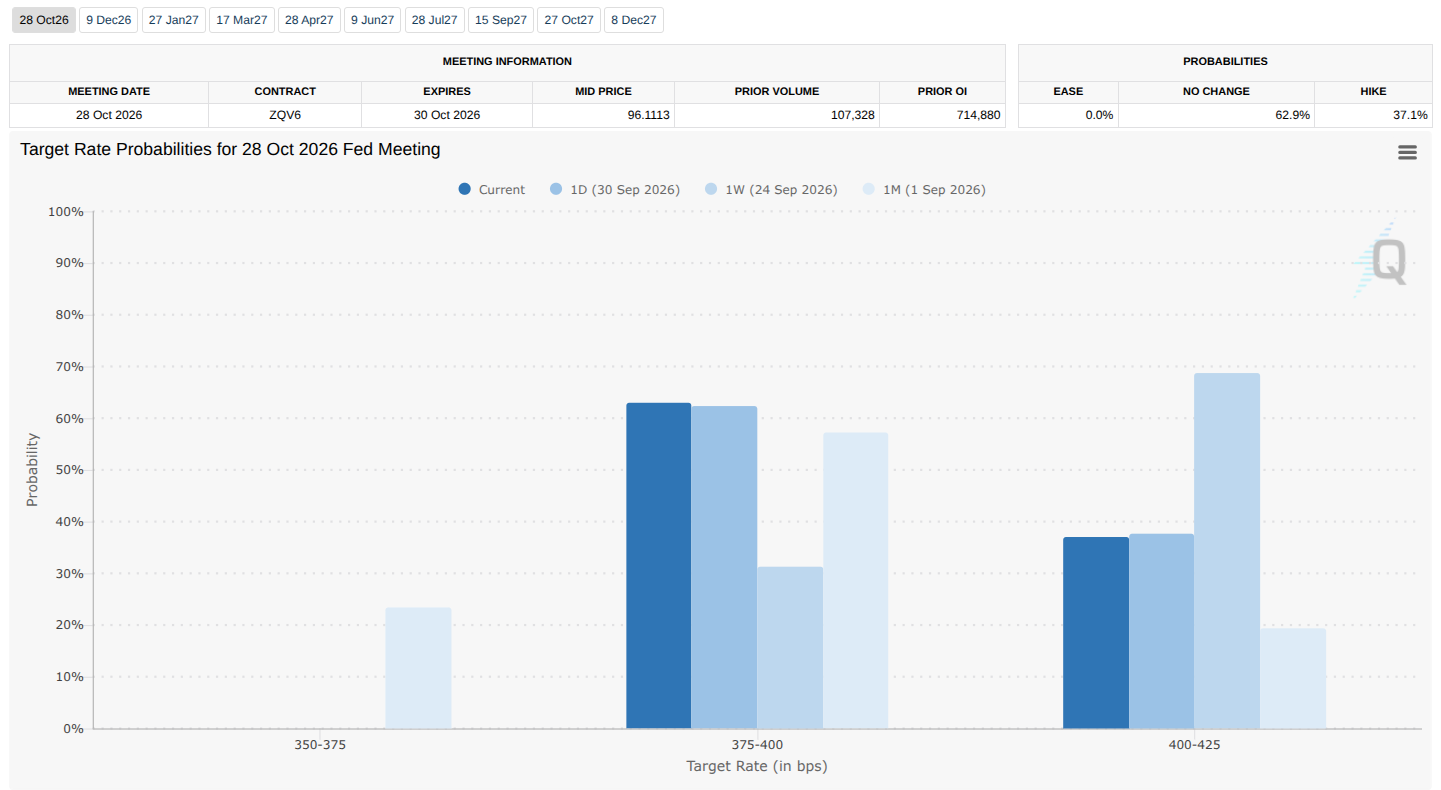
According to data from the CME FedWatch Tool, markets on Wednesday placed the probability of a quarter-percentage-point rate increase at the Fed’s October meeting at approximately 37%. This figure represented little change on the day, indicating that despite the lower inflation print, a significant portion of the market still braced for a potential hike. However, a notable shift from the previous week’s sentiment saw markets leaning towards keeping the federal funds target range unchanged at 3.75%–4%. This shift suggests that while rate hikes remain a possibility, the momentum for further tightening may be waning, giving way to an expectation of a pause. The Fed’s decisions will continue to be heavily influenced by incoming economic data, including subsequent inflation reports, labor market statistics, and broader economic growth indicators. Any definitive signal from the Fed regarding its forward guidance could have profound implications for Bitcoin and other risk assets, as lower interest rates generally make speculative investments more attractive.
Bitcoin’s Stellar Third Quarter Performance
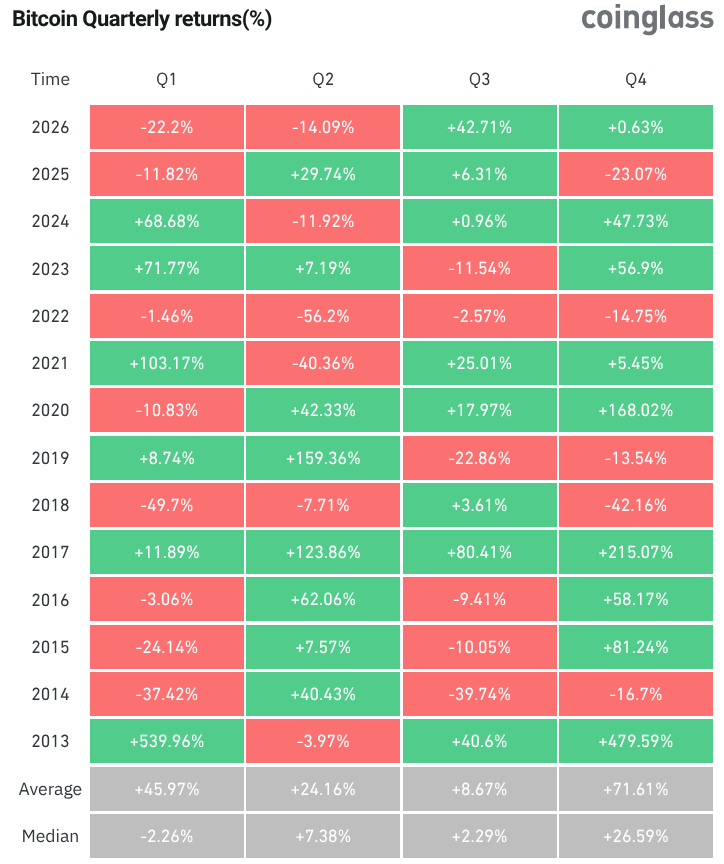
Amidst the immediate market fluctuations, it is crucial to contextualize Bitcoin’s recent performance within a broader timeframe. Bitcoin concluded the third quarter with remarkable strength, posting gains of 42.7%. This impressive performance, according to data from CoinGlass, marks its best Q3 since 2017, underscoring a period of robust growth for the leading cryptocurrency. The substantial quarterly appreciation provides a strong foundation as Bitcoin now enters the fourth quarter (Q4).
Historically, Q4 has been Bitcoin’s strongest quarter, often characterized by significant price rallies. Starting Q4 at approximately $83,550, Bitcoin finds itself in a favorable position to potentially capitalize on this historical trend. The consistent outperformance in Q3, particularly against a backdrop of ongoing macroeconomic uncertainties and regulatory scrutiny, highlights Bitcoin’s increasing maturity and its ability to attract sustained investor interest. This strong quarterly close suggests underlying demand and potentially renewed confidence in the asset class, setting an optimistic tone for the remainder of the year. The resilience demonstrated through a challenging economic period could reinforce Bitcoin’s narrative as a store of value and a hedge against traditional market volatility for some investors.
Technical Analysis and Liquidation Dynamics
Understanding the immediate technical landscape is critical for assessing Bitcoin’s short-term movements. Market analysis frequently employs tools like liquidation heatmaps, provided by platforms such as CoinGlass, to identify areas of potential price sensitivity. These heatmaps visualize clusters of estimated liquidation exposure, indicating where large leveraged positions might be forcibly closed if the price moves against them, often leading to cascading price movements.
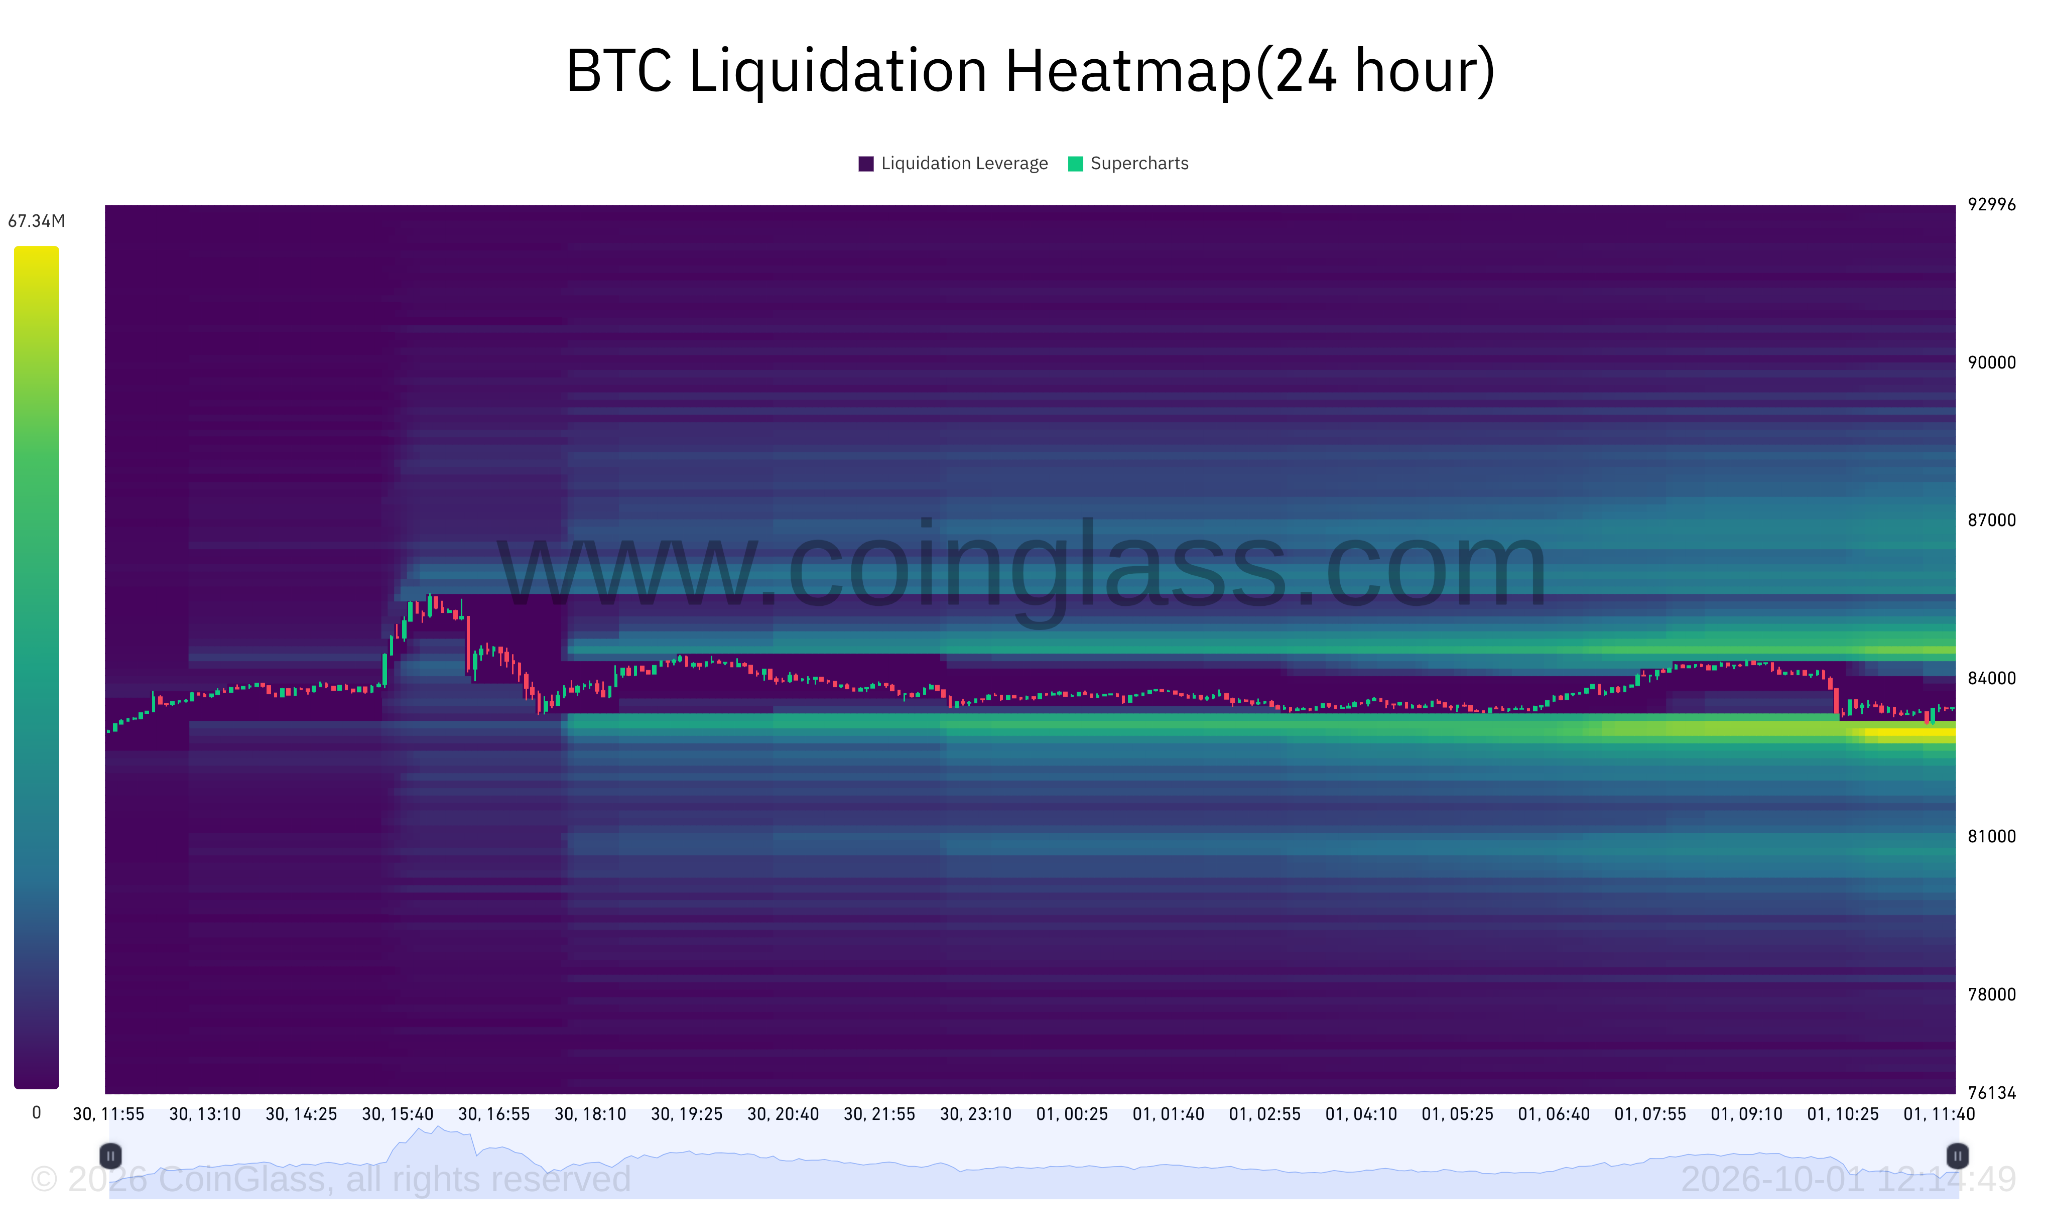
On Thursday, a new and significant $60 million cluster of estimated liquidation exposure emerged near $83,000. This cluster is particularly noteworthy as it sits close to a key support level identified at $82,500. For market analysts, the $82,500 level has been marked as critical for Bitcoin’s broader rebound trajectory, especially in its recovery from the lows observed in June. A strong defense of this support level could signal continued bullish momentum, while a break below it could trigger further downside pressure as liquidations cascade. Conversely, liquidation clusters above the current market price represent potential targets for upward movements, as price surges could trigger short squeezes. The presence of these clusters above and below Bitcoin’s current market price indicates a market with significant leveraged positions, making it susceptible to volatility around these key price points.
Futures Market Dynamics: Open Interest and Leverage
Beyond immediate liquidation levels, the broader health of Bitcoin’s rally can be assessed through futures market dynamics, specifically by examining open interest (OI). Open interest measures the total number of outstanding futures contracts that have not yet been settled, providing insight into the amount of capital currently leveraged in the market. A high open interest, especially when denominated in Bitcoin, can suggest an overheated market prone to sharp corrections through "leverage flushes" – large-scale forced liquidations that accelerate price declines.
However, recent data from on-chain analytics platform Glassnode indicates a potentially healthier trend. Glassnode highlighted a divergence between Bitcoin’s price appreciation and the level of BTC-denominated open interest. While Bitcoin’s price surged by 35% from its August low, coin-denominated open interest simultaneously declined by almost 20%. This puts open interest at its lowest level since March. Glassnode analysts suggest that this divergence could make the current rally "less susceptible to leverage flushes." A lower open interest implies that there is less speculative leverage in the system, reducing the risk of a domino effect of liquidations that could otherwise destabilize the market during price pullbacks. This deleveraging trend, even as prices rise, can be interpreted as a sign of a more sustainable and robust rally, built on genuine demand rather than excessive speculation.
Resistance Levels and Long-Term Holder Behavior
The path for Bitcoin’s upward movement is not without its obstacles. Previous analysis has identified significant resistance levels, particularly around the $85,000-$85,600 range, where Bitcoin’s latest rally stalled on Wednesday. These resistance zones are often reinforced by a confluence of factors, including concentrated sell orders and the behavior of long-term holders.
Long-term holders (LTHs) are investors who typically hold their Bitcoin for extended periods, often accumulating during dips and selling during significant rallies. Data indicates that a substantial cluster of long-term holder coins is concentrated within the $84,000-$85,000 range. When price approaches these levels, these LTHs may choose to take profits, creating selling pressure that reinforces resistance. This behavior is a natural part of market cycles, where smart money tends to de-risk after substantial gains. The presence of these sell orders and LTH profit-taking clusters means that breaking through the $85,000 resistance will require significant buying volume and sustained bullish momentum. Overcoming such resistance would signal a strong conviction among buyers and could pave the way for further price discovery, potentially shifting the market sentiment towards higher targets.
Broader Impact and Future Implications
The interplay of macroeconomic data, technical indicators, and market participant behavior continues to shape Bitcoin’s trajectory. The latest PCE inflation data, while initially causing a ripple, highlights the ongoing sensitivity of digital assets to traditional economic narratives. The Federal Reserve’s future policy decisions, particularly regarding interest rates, will remain a critical determinant for risk assets like Bitcoin. A sustained period of lower inflation, coupled with a dovish shift from the Fed, could create a more favorable environment for growth-oriented investments, including cryptocurrencies.
Looking ahead, Bitcoin’s entry into Q4 with strong momentum from its best Q3 since 2017 offers a compelling narrative. While historical performance does not guarantee future results, the seasonal strength of Q4, combined with a healthier futures market characterized by lower open interest, suggests a potentially more stable and sustainable growth path. However, investors must remain vigilant, monitoring not only the critical support and resistance levels identified through technical analysis but also the evolving global macroeconomic landscape. The cautious reaction to the PCE data, coupled with skepticism about its methodological adjustments, serves as a reminder that the path to widespread economic stability and sustained market rallies is often complex and subject to re-evaluation. As Bitcoin continues to mature as an asset class, its interactions with traditional financial markets and global economic forces will only become more pronounced, demanding a holistic analytical approach from investors.
This article is produced in accordance with standard journalistic practices and is intended for informational purposes only. It does not constitute investment advice or recommendations. All investments and trades carry risk; readers are encouraged to conduct independent research.