James Watt
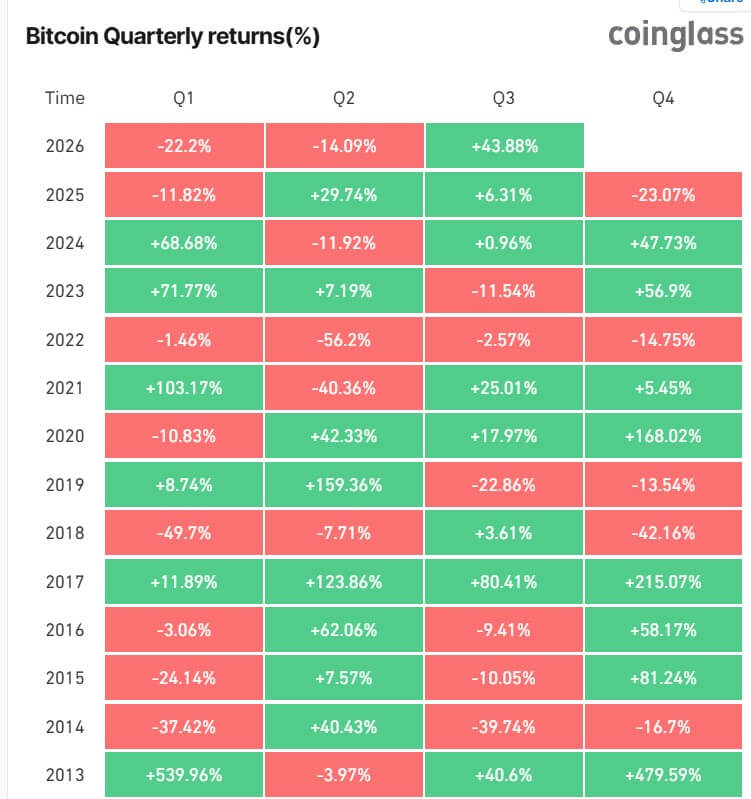
Bitcoin has concluded its most robust third quarter in over a decade, significantly outpacing traditional benchmarks such as U.S. equities and gold, even as macroeconomic pressures and surging bond yields created a challenging environment for non-yielding assets. The world’s largest digital asset recorded a gain of approximately 43% during the third quarter of 2026, marking its second-best performance for this specific period since 2013 and its third-strongest quarterly advance since the landmark introduction of U.S. spot Bitcoin exchange-traded funds (ETFs) in early 2024.
According to data compiled by Bitfinex and CoinGlass, the digital currency’s rally stands in stark contrast to the modest gains seen in legacy markets. Over the same three-month window ending September 29, the tech-heavy Nasdaq Composite rose by roughly 5%, the S&P 500 gained 4%, and gold—traditionally viewed as the primary hedge against economic instability—managed a return of less than 2%. This divergence highlights a significant decoupling of Bitcoin from traditional risk-on assets, driven largely by a fundamental shift in market participation from speculative leverage toward institutional spot accumulation.
The Quarterly Trajectory: From Capitulation to Accumulation
The quarter began under a cloud of uncertainty. Entering July, Bitcoin was trading near the $58,600 mark, reeling from three consecutive quarterly declines that had left a significant portion of the investor base in a "submerged" position, where the market price was lower than their average purchase price. However, the narrative shifted as the quarter progressed. July served as a period of stabilization, while August and September saw a rapid acceleration in price action.
This momentum was fueled by the steady absorption of "underwater" supply. Sellers who had held through the lean months of early 2026 began exiting their positions as prices climbed, but rather than triggering a collapse, this selling pressure was met by a wall of institutional demand. By the time September reached its midpoint, the market had transitioned from a state of defensive posture to one of aggressive recovery.
While Bitcoin led the charge, the broader cryptocurrency market also showed signs of renewed vigor. Ethereum emerged as a notable exception to the rule of Bitcoin dominance, occasionally outperforming the market leader as the rally broadened. This suggests that the "crypto rebound" was not merely a flight to the safety of Bitcoin but a systemic re-evaluation of digital assets as a whole.
The Treasury Yield Paradox and the Liquidity Injection
One of the most remarkable aspects of Bitcoin’s Q3 performance was its ability to thrive despite a hostile interest rate environment. Historically, rising Treasury yields are a headwind for Bitcoin, as higher returns on government debt increase the opportunity cost of holding assets that do not produce a yield. During the quarter, the 10-year Treasury yield climbed approximately 81 basis points, with long-dated borrowing costs reaching multi-decade highs.
The acceleration of Bitcoin’s price after August 19 coincided with a strategic move by the U.S. Treasury Department to improve liquidity in the government debt market. The department announced it would double the maximum size of liquidity-support buybacks for longer maturities to $4 billion per operation, a program that officially commenced on September 9. Although this initiative failed to stop yields from rising, it appears to have injected a sense of liquidity confidence into the broader financial system. Since that announcement, Bitcoin has risen nearly 30%, suggesting that the digital asset is increasingly sensitive to global liquidity cycles rather than just nominal interest rates.
Institutional Reinforcement: The ETF Pivot
The structural backbone of this quarter’s rally was the dramatic reversal in flows within the U.S. spot Bitcoin ETF sector. At the end of July, these products were facing a bleak outlook, with year-to-date net outflows totaling roughly $5 billion. However, as financial conditions tightened in traditional sectors, the ETFs became a primary vehicle for fresh capital entry.

By late September, the year-to-date figure had swung to $1 billion in net inflows—a massive $6 billion turnaround in just two months. This shift culminated in the final week of the quarter, which saw the products absorb $2.39 billion, their largest weekly intake since October 2025. This institutional "buying spree" saw five consecutive days of positive inflows, peaking at $999 million in a single session on September 21. While the daily demand eventually moderated to approximately $135 million by September 25, the sheer volume of capital confirmed that Wall Street has replaced retail leverage as the primary driver of price discovery.
Analysts at Nexo noted that the market structure has improved significantly as Bitcoin enters the final quarter of the year. The reliance on spot demand rather than futures-based speculation is generally viewed as a sign of a maturing and more sustainable bull market. However, they cautioned that the outlook remains contingent on several factors: the persistence of ETF inflows, the successful absorption of overhead supply, and an inflation environment that remains stable enough to prevent the Federal Reserve from further aggressive tightening.
Deleveraging and the Shift to Spot Ownership
While institutional spot buying surged, the speculative side of the market underwent a significant contraction. Aggregate Bitcoin futures open interest—a measure of the total number of outstanding derivative contracts—dropped from over 700,000 BTC on September 21 to approximately 644,000 BTC by the end of the month. This represents the lowest level of open interest since early January.
The seven-day contraction of 49,000 BTC was the largest since late 2025, and the CME Group saw its third-biggest daily decline in open interest on record. This "unwind" of leverage is a double-edged sword. On one hand, it removes the "fuel" that often leads to cascading liquidation events and sharp selloffs. On the other hand, it removes the speculative buying power that typically propels the parabolic price advances associated with previous bull runs.
With leverage at a minimum and futures premiums compressing, the responsibility for price appreciation now rests squarely on the shoulders of outright buyers. Bitfinex data suggests this transition is already underway. The amount of Bitcoin with a cost basis between $82,500 and $84,000 nearly tripled to 306,000 tokens in a matter of days. This indicates that buyers are actively absorbing coins from two distinct groups: long-term holders taking profits and newer investors exiting at a loss after the recent retreat from the $87,400 high.
Technical Barriers and the 1.39 Million Bitcoin Wall
Despite the bullish quarterly close, Bitcoin faces a formidable "wall" of resistance immediately above its current price. Analysis by Bitfinex and CryptoQuant identifies a massive concentration of supply between $84,000 and $86,500. It is estimated that investors hold approximately 1.39 million BTC acquired within this range.
This group is composed of two primary cohorts: "trapped" buyers who entered near the September peak and long-term holders who are finally seeing the market return to their breakeven points. This creates a "supply overhang," where every attempt to push the price higher is met with a wave of selling from investors simply looking to "get out even."
To clear this hurdle, demand must significantly outweigh the natural issuance of new coins by miners. Bitfinex estimates that the ratio of ETF purchases to daily miner production needs to stay around five times issuance—roughly $190 million in daily ETF demand—to effectively chew through this overhead supply. For context, during the peak of the September rally, this ratio hit 25.6 times issuance, but it has since cooled to 1.8 times.
However, there are positive technical signals. Bitcoin recently reclaimed its 365-day moving average for the first time since early 2023. Historically, staying above this long-term gauge has been a prerequisite for sustained bull markets. Additionally, Bitcoin’s "realized price"—the average cost at which all coins in circulation last moved—has climbed to $77,000, providing a solid floor for the current recovery.
Seasonality and the Path to the Fourth Quarter
As the calendar turns to October, the "seasonality" argument becomes a central theme for market participants. The fourth quarter has historically been Bitcoin’s most profitable period. Since 2013, the average return for Q4 has ranged between 77% and 85%.
BloFin Research has modeled these historical averages against current prices. A return matching the 77% historical average would theoretically propel Bitcoin to $147,000 by year-end. Even a more conservative median return of 47% would imply a price of roughly $123,000. While these projections are purely mechanical and do not account for the diminishing returns often seen in later market cycles, they underscore the optimistic sentiment prevalent among traders.
The options market reflects this "moonshot" mentality. Nexo reports that the $140,000 call options expiring on December 25 represent the largest individual position in the derivatives market. The put-to-call ratio, currently at 0.67, further indicates that traders are positioned for upward movement rather than hedging for a crash.
Macroeconomic Headwinds: The Fed and the Labor Market
The primary risk to the "Q4 Moon" thesis remains the Federal Reserve. The market’s expectations for interest rate hikes have been volatile. While softer inflation data recently reduced the probability of an October rate hike from 65% to 38%, the outlook remains data-dependent.
The upcoming October 2 U.S. payrolls report will be the next major litmus test. If the economy shows signs of overheating, it could reignite fears of "higher for longer" rates, potentially driving Treasury yields even higher and putting pressure on Bitcoin’s spot demand. A warning sign occurred on September 28, when the Nasdaq-100, gold, and Bitcoin all fell in tandem. Analysts noted that this synchronized drop was characteristic of broad-market deleveraging rather than a specific rejection of crypto, reminding investors that Bitcoin is not yet fully immune to systemic shocks.
For the immediate future, $81,300 has been identified as a critical support level. A failure to hold this threshold, combined with a potential reversal in ETF flows, could see the price drift back toward the realized-price support at $77,000. Conversely, a clean break above the $86,500 supply wall would leave the path open to challenge the yearly open of $87,700 and the psychological $90,000 barrier.
As Bitcoin enters its historically strongest season, the interplay between massive institutional inflows and multi-decade high bond yields will determine whether the "1.39 million Bitcoin wall" is a ceiling or merely a temporary hurdle on the path to new all-time highs.