James Watt
The global cryptocurrency market remains in a state of calculated suspension this weekend as Bitcoin (BTC) trades near the $64,500 mark, positioned precisely between a formidable $65,000 resistance level and a crucial $62,500 support floor. This narrow corridor is expected to define the digital asset’s trajectory for the final week of July, a period already charged with anticipation regarding macroeconomic shifts and institutional capital flows.
As of the current trading session, Bitcoin’s price action reflects a period of consolidation following a volatile month. After climbing to a one-month high of $66,990 on July 21, the asset experienced a retracement, slipping back below the $65,000 threshold. This former breakout line has now transitioned into overhead resistance, creating a technical hurdle that bulls must overcome to regain momentum. Market observers note that trading volume over the last 24 hours has plummeted more than 40% below recent averages. This decline in liquidity is a hallmark of weekend crypto trading, often leading to "wicks" or price fluctuations that lack the necessary volume to be considered definitive until the weekly candle closes on Sunday.
The Chronology of July’s Market Dynamics
To understand the current "decision map" facing traders, it is essential to review the sequence of events that led to this weekend’s stalemate. The month of July began with a tentative recovery as Bitcoin sought to distance itself from the June lows that had tested investor resolve. By mid-month, optimism returned, fueled by a cooling in selling pressure from government-related wallets and a stabilizing macro environment in the United States.
On July 21, Bitcoin reached its monthly peak of $66,990, briefly igniting hopes of a return to the $70,000 range. However, the momentum shifted abruptly on July 24. On that day, U.S.-traded spot Bitcoin Exchange-Traded Funds (ETFs) recorded a significant net outflow of $240 million. This single-day exodus of institutional capital acted as a catalyst for the slide below $65,000, effectively turning a support level into a ceiling within hours.
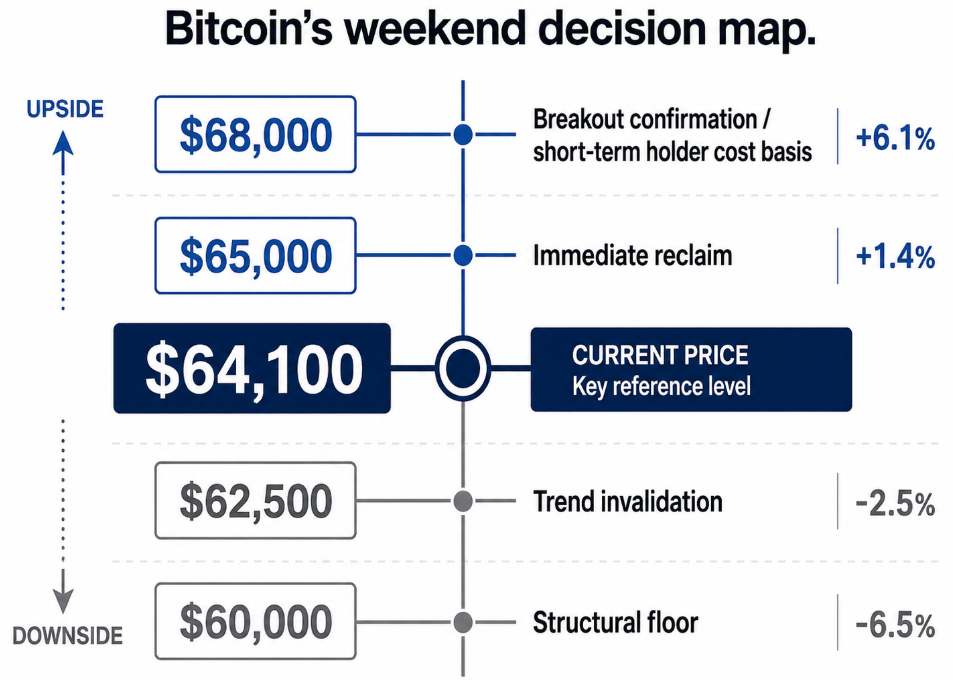
This pullback has set the stage for a four-price decision map that analysts believe will dictate the market’s direction heading into August.
The Four Pillars of the Weekend Decision Map
Market participants are currently focused on four specific price levels: two providing upside targets and two serving as downside safety nets.

1. The Immediate Reclaim: $65,000
From its current position, Bitcoin requires a modest 1.4% gain to move back above $65,000. A confirmed close above this level on Sunday evening would suggest that the July 24 sell-off was a "failed breakdown"—a temporary dip that failed to attract sustained selling pressure. For traders who entered long positions during the mid-July breakout, this level is the line in the sand. A failure to reclaim it by the weekly close may prompt a reduction in exposure before Monday’s high-volume opening.
2. The Breakout Confirmation: $68,000
Should $65,000 be reclaimed, the next major hurdle is $68,000. This level is significant not just as a round number, but as a critical psychological and technical junction. Data from Bitfinex indicates that the short-term holder (STH) cost basis currently sits near $68,073. This cohort, which includes investors who have held Bitcoin for less than 155 days, often acts as a source of "breakeven" supply. If the price reaches this zone, many STHs who bought near the top of the second quarter may look to exit their positions without a loss, creating a "wall of supply" that could stall further rallies.
3. The Trend Invalidation: $62,500
On the downside, the integrity of the July recovery rests on holding $62,500. Technical assessments, including those highlighted by Barron’s, suggest that Bitcoin has established a sequence of "higher lows" throughout the month. This structure remains valid only as long as $62,500 remains intact. A breach of this level would invalidate the bullish inverse head-and-shoulders pattern that analysts have identified, potentially signaling that the move toward $67,000 was a "bull trap" rather than a sustainable breakout.
4. The Structural Floor: $60,000
The final line of defense is the $60,000 mark. Throughout 2026, buyers have repeatedly defended this level, forming what technical analysts describe as a potential triple bottom. Currently sitting approximately 6.5% below the market price, $60,000 represents the floor of the range Bitcoin has occupied for several months. A decisive break below this support would likely expose the June lows and suggest that the market has not yet found a durable bottom.
Institutional Sentiment and the Role of Spot ETFs
The influence of U.S. spot Bitcoin ETFs cannot be overstated in the current market environment. The $240 million outflow on July 24 served as a stark reminder of how institutional sentiment can rapidly alter price structures. When these funds experience heavy outflows, it often signals a "risk-off" pivot among traditional investors, which in turn pressures the spot price of Bitcoin.
Conversely, the return of ETF demand on Monday could provide the necessary liquidity to push Bitcoin through the $65,000 resistance. Analysts are closely watching for signs of renewed institutional appetite, which often correlates with broader market sentiment regarding inflation and interest rate policy.
Macroeconomic Convergence: The Fed and Policy Week
The timing of this weekend’s price squeeze is particularly sensitive due to the upcoming Federal Reserve meeting scheduled for July 28-29. While market participants do not universally expect a rate cut in July, the language used by Fed officials will be scrutinized for hints of a September pivot.
Bitcoin has historically behaved as a high-beta "risk-on" asset, meaning its price is sensitive to liquidity conditions and interest rate expectations. A hawkish stance from the Fed—suggesting that rates will stay higher for longer—could strengthen the U.S. Dollar and Treasury yields, both of which typically act as headwinds for Bitcoin. On the other hand, any indication of an impending easing cycle could provide the tailwind needed for Bitcoin to challenge the $68,000 "wall of supply."
Beyond the Fed, other macro factors are converging on the crypto market. Oil prices, Treasury yields, and the performance of AI-driven tech stocks are all currently showing high correlations with Bitcoin. In particular, the "AI trade" has recently seen increased volatility; should investors rotate out of tech stocks, the impact on Bitcoin’s liquidity remains an open question.
Analysis of Potential Outcomes
As the Sunday close approaches, two primary scenarios emerge for the week ahead.
The Bullish Case:
In this scenario, Bitcoin manages a sustained move above $65,000 by Sunday night. This would characterize the recent dip as a healthy consolidation. When traditional markets reopen on Monday, positive ETF inflows return, and the Fed’s messaging leans toward a "dovish" outlook for the remainder of the year. This would likely propel Bitcoin toward $68,000, where clearing the short-term holder cost basis would signal that the July rebound has evolved into a durable uptrend.
The Bearish Case:
In the alternative scenario, Bitcoin fails to hold $62,500 by the weekly close, erasing the progress made in the first half of July. Monday brings a continuation of ETF outflows, and a firming of the U.S. Dollar. In this environment, sellers would likely press the price toward the $60,000 structural floor. A failure to hold $60,000 would be a significant blow to market sentiment, potentially ending the "triple bottom" narrative and inviting a retest of the year’s lower bounds.
Conclusion: A Two-Stage Resolution
The current market setup resolves in two distinct stages. The first stage is Sunday’s weekly close, which will provide a technical signal based on thin, weekend liquidity. The second, and perhaps more vital stage, is Monday’s market open. This is when "real" volume returns, ETF flows are settled, and the broader financial world reacts to the upcoming Fed meeting.
For now, Bitcoin remains in a holding pattern. The four price levels—$68,000, $65,000, $62,500, and $60,000—serve as the boundaries for this period of price discovery. Investors and traders alike are left to wait for the Sunday close to determine whether the coming week will be defined by a breakout toward new highs or a retreat to familiar floors. By Monday morning, the market will have its answer, as the transition from weekend speculation to weekday institutional reality takes hold.