James Watt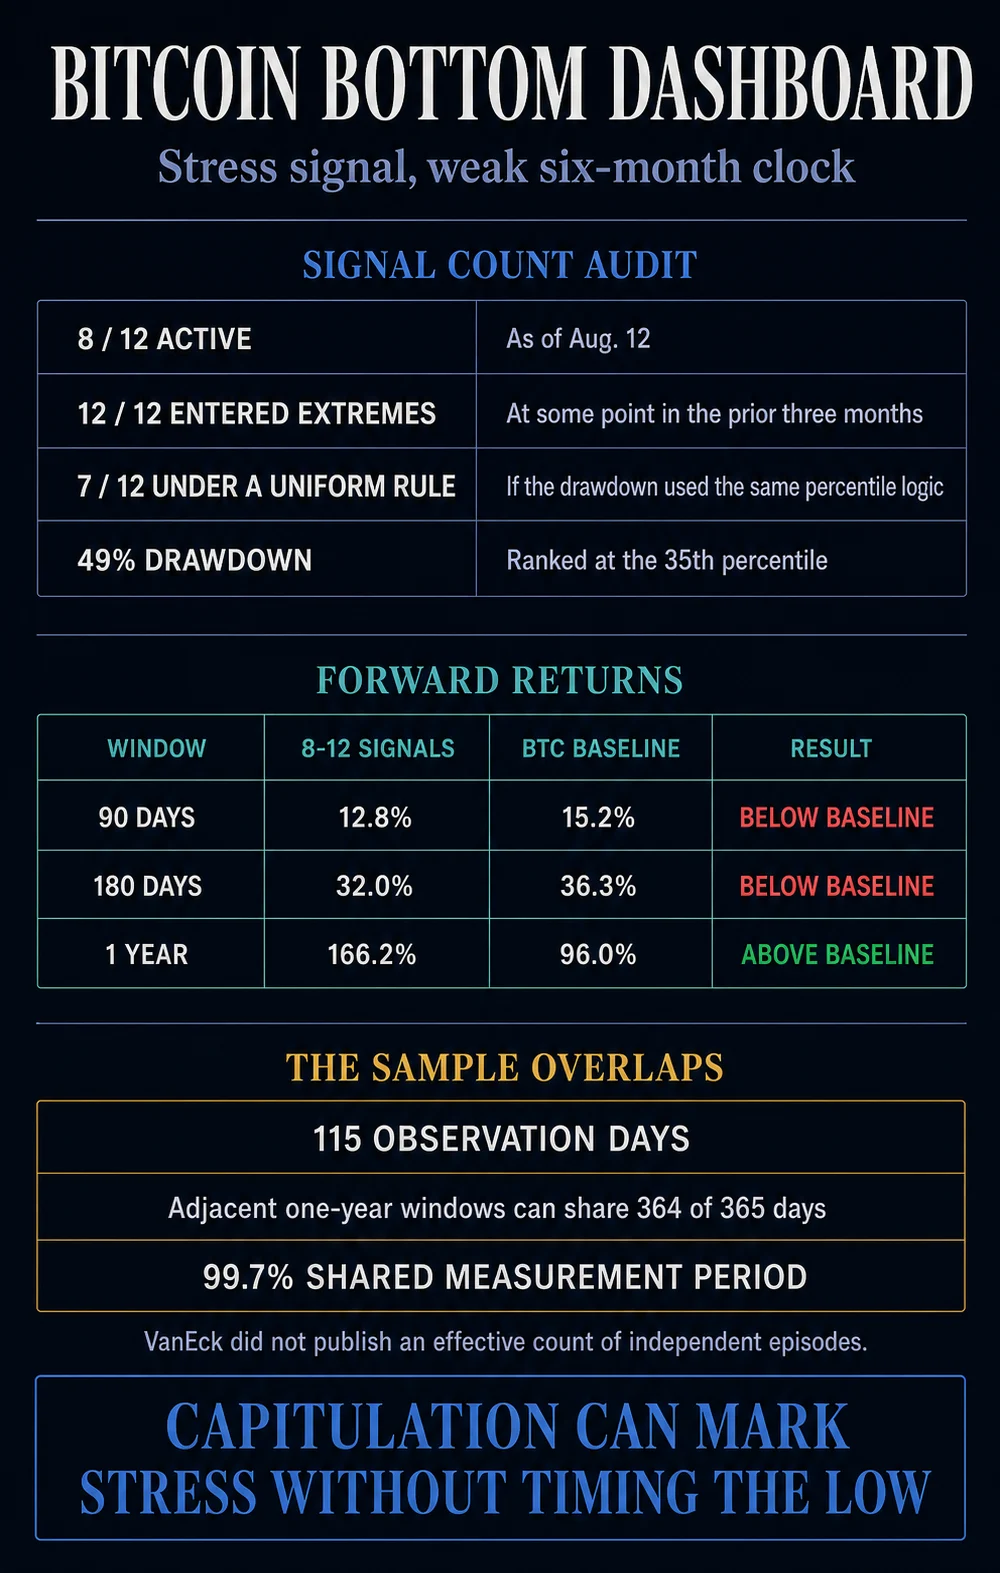
The late-August recovery of Bitcoin has emerged as a multi-stage phenomenon, transitioning from a sharp technical rebound driven by bearish liquidations to a more fundamental accumulation phase supported by institutional inflows. This recovery gained significant attention following the release of data from VanEck’s proprietary capitulation dashboard, which, just days prior to the August 19 price surge, signaled intense market stress. On August 12, the dashboard indicated that eight of its 12 core signals were active, suggesting a level of market exhaustion often associated with cyclical bottoms. While the initial upward movement appeared to be a direct response to a "reset" in bearish positioning, the sustainability of the trend has since been bolstered by a broadening of demand across exchange-traded funds (ETFs) and diverse wallet cohorts.
VanEck’s historical analysis serves as a critical lens for interpreting these signals, emphasizing the distinction between identifying capitulation and accurately timing market entries. According to historical data provided by the investment firm, periods characterized by dense clusters of capitulation signals have often preceded periods of relative underperformance in the short to medium term. Specifically, when eight to 12 signals are active, Bitcoin has historically trailed its "all-days" performance baseline over the subsequent 90 and 180 days. However, the one-year outlook remains significantly more optimistic, with historical returns far exceeding the baseline. This suggests that while the dashboard is an effective tool for identifying structural stress, its utility as a short-term timing mechanism is limited by the inherent volatility and lag associated with market recoveries.
The Architecture of Capitulation: Decoding the VanEck Dashboard
The VanEck capitulation dashboard is built upon 12 distinct indicators designed to measure the intensity of selling pressure and the psychological state of market participants. Of these, 11 indicators utilize historical percentile extremes to determine their "active" status. The 12th indicator, price drawdown, operates on a fixed rule: it triggers when Bitcoin experiences a decline of at least 35% from its peak. During the market turbulence observed in mid-August, VanEck recorded a drawdown of 49%. Interestingly, while this 49% drop comfortably cleared the 35% threshold for the dashboard, it only ranked in the 35th percentile of historical Bitcoin drawdowns. This nuance highlights the severity of Bitcoin’s historical volatility; a nearly 50% retracement, while catastrophic in traditional finance, is relatively common within the context of Bitcoin’s lifecycle.
On August 26, the narrative surrounding these signals was amplified by "The Bitcoin Historian," Pete Rizzo, who noted in a social media post that all 12 signals had entered extreme territory at some point during the preceding three months. While the "12 out of 12" shorthand provided a bullish headline for market enthusiasts, the underlying data was more nuanced. On the specific observation date of August 12, only eight signals were actively firing. If the price-drawdown indicator had been subjected to the same percentile-based logic as the other 11 signals, the count would have dropped to seven. This distinction is vital for institutional investors who rely on statistical consistency to drive capital allocation.
The dashboard’s forward-return table provides a sobering counter-narrative to immediate bullishness. Historically, when eight to 12 signals are active, Bitcoin’s 90-day forward return averages 12.8%, compared to a baseline of 15.2%. Similarly, the 180-day return stands at 32.0%, trailing the 36.3% baseline. It is only at the one-year mark that the "capitulation" signal shows its strength, delivering a 166.2% return against a 96.0% baseline. However, analysts caution against overstating the statistical weight of these figures. The sample size consists of 115 observation days, many of which are heavily overlapping. In statistical terms, two one-year windows starting just one day apart share over 99% of their data points, meaning the 115 observations do not represent 115 independent market cycles, but rather a few distinct episodes of extreme stress.
Chronology of the August Recovery
The path to the current market state began with the systemic volatility observed in early August, largely triggered by broader macroeconomic shifts and the unwinding of the Japanese Yen carry trade. This global de-risking event pushed Bitcoin to local lows, setting the stage for the capitulation readings identified by VanEck.
August 12: VanEck’s dashboard records eight active capitulation signals. The market remains in a state of high anxiety, with sentiment skewed heavily toward the "Fear" end of the Fear and Greed Index.
August 19: Bitcoin experiences a major "positioning reset." This day marked the largest single-day short-liquidation event since 2019, according to data from Glassnode. As the price began to climb, traders holding short positions were forced to buy back Bitcoin to cover their losses, creating a feedback loop that accelerated the upward move. Shorts accounted for approximately 85% of total liquidations during this window.
August 20-25: The recovery transitions from a technical squeeze to a demand-driven phase. US-based spot Bitcoin ETFs see a significant resurgence in activity. Over a seven-day period, these instruments recorded $2.23 billion in net creations without a single day of outflows. Average daily turnover for the ETFs reached $2.4 billion, signaling robust institutional engagement.
August 26: Market commentary shifts toward the "12 out of 12" signal milestone, further fueling retail interest. Simultaneously, on-chain data begins to show coins moving off exchanges and into private wallets, a classic sign of long-term accumulation.

Technical Analysis and Positioning Resets
The August 19 rally was a pivotal moment for Bitcoin’s short-term price action. By clearing out a significant portion of the bearish leverage in the system, the market was able to find a more stable floor. Glassnode’s analysis of the event highlighted that futures open interest fell by 11% in Bitcoin terms during the squeeze. Crucially, funding rates—the cost of holding leveraged long positions—remained near neutral. This absence of a funding spike suggested that the rally was not merely a "leveraged long chase" but was instead a healthy flushing of lopsided bearish bets.
This sequence explains how Bitcoin’s price could outrun the backward-looking signals of the VanEck dashboard. While the dashboard identified that the market had been in a state of capitulation, the short squeeze provided the mechanical catalyst for the price to move higher. The subsequent stability of the rally has been attributed to the shift from "paper Bitcoin" (derivatives) to "physical Bitcoin" (spot accumulation).
Institutional Influence: The ETF and Wallet Accumulation Factor
The role of US spot Bitcoin ETFs in this recovery cannot be understated. The $2.23 billion in net creations over late August suggests that institutional investors viewed the capitulation-level prices as a strategic entry point. According to Farside Investors’ daily flow tables, the positive momentum was consistent across multiple sessions, providing a "wall of money" that absorbed any residual selling pressure from the August 5 crash.
Beyond ETFs, accumulation patterns across different wallet sizes have shown a rare synchronization. Glassnode’s "Accumulation Score" indicated that all six wallet-size cohorts—ranging from "shrimps" (holding less than 1 BTC) to "whales" (holding over 10,000 BTC)—were at or above neutral levels. This broad-based participation suggests that the recovery is not being driven by a single class of investor but is a market-wide response to the perceived undervaluation of the asset during the capitulation phase.
The Long-Term Holder Divergence
Despite the bullish accumulation data, one on-chain metric remains a point of contention among analysts. VanEck reported that the total supply of Bitcoin held for more than one year fell by 356,534 BTC over a 30-day period, dropping to 11.84 million BTC. This represents approximately 59.1% of the total circulating supply.
A decline in long-term holder (LTH) supply can be interpreted in several ways. In a bearish context, it suggests "distribution," where seasoned investors sell their holdings to newer, less experienced participants. In a more neutral or bullish context, it may reflect "wallet churn"—the movement of coins between wallets owned by the same entity—or migration to new institutional custody solutions. VanEck noted that without an age-band split of exchange inflows, it is difficult to determine whether these coins were actually sold on the open market or simply moved to more modern security architectures.
Glassnode’s accumulation scores provide a different dimension to this data. It is possible for all wallet cohorts to be accumulating new coins while the total share of "aged" coins falls, particularly if the selling is concentrated among a few very old whales or defunct entities (such as the ongoing distribution of Mt. Gox or government-seized funds). Therefore, the drop in LTH supply does not necessarily negate the recovery case, but it does highlight a shift in the "age" of the liquid supply.
Broader Impact and Market Implications
The synthesis of VanEck’s dashboard and real-time on-chain data points toward a "staged recovery" model. The first stage was characterized by broad capitulation conditions, which created the psychological and technical environment for a bottom. The second stage involved the clearing of bearish positioning through the August 19 short squeeze. The third, and current, stage is the broadening of support through ETF flows and multi-cohort wallet accumulation.
The implications for the coming months are twofold. On one hand, historical data suggests that investors should temper their expectations for the 90-to-180-day window. If Bitcoin follows the path of previous capitulation clusters, it may continue to trade within a range or slightly underperform its historical averages as the market digests the recent volatility. On the other hand, the one-year outlook remains exceptionally strong, provided the structural support from ETFs and institutional adoption continues to mature.
The recovery case rests not on a single "bottom call" from a dashboard, but on the market’s demonstrated ability to transition from a state of extreme stress to one of sustained demand. While the VanEck dashboard provided the "snapshot" of a market in distress, the subsequent actions of ETF participants and long-term accumulators are what have provided the "clock" for the recovery. As Bitcoin moves into the final quarter of the year, the focus will likely shift from these backward-looking capitulation signals to the macroeconomic environment, including potential interest rate adjustments by the Federal Reserve and the evolving regulatory landscape in the United States.