James Watt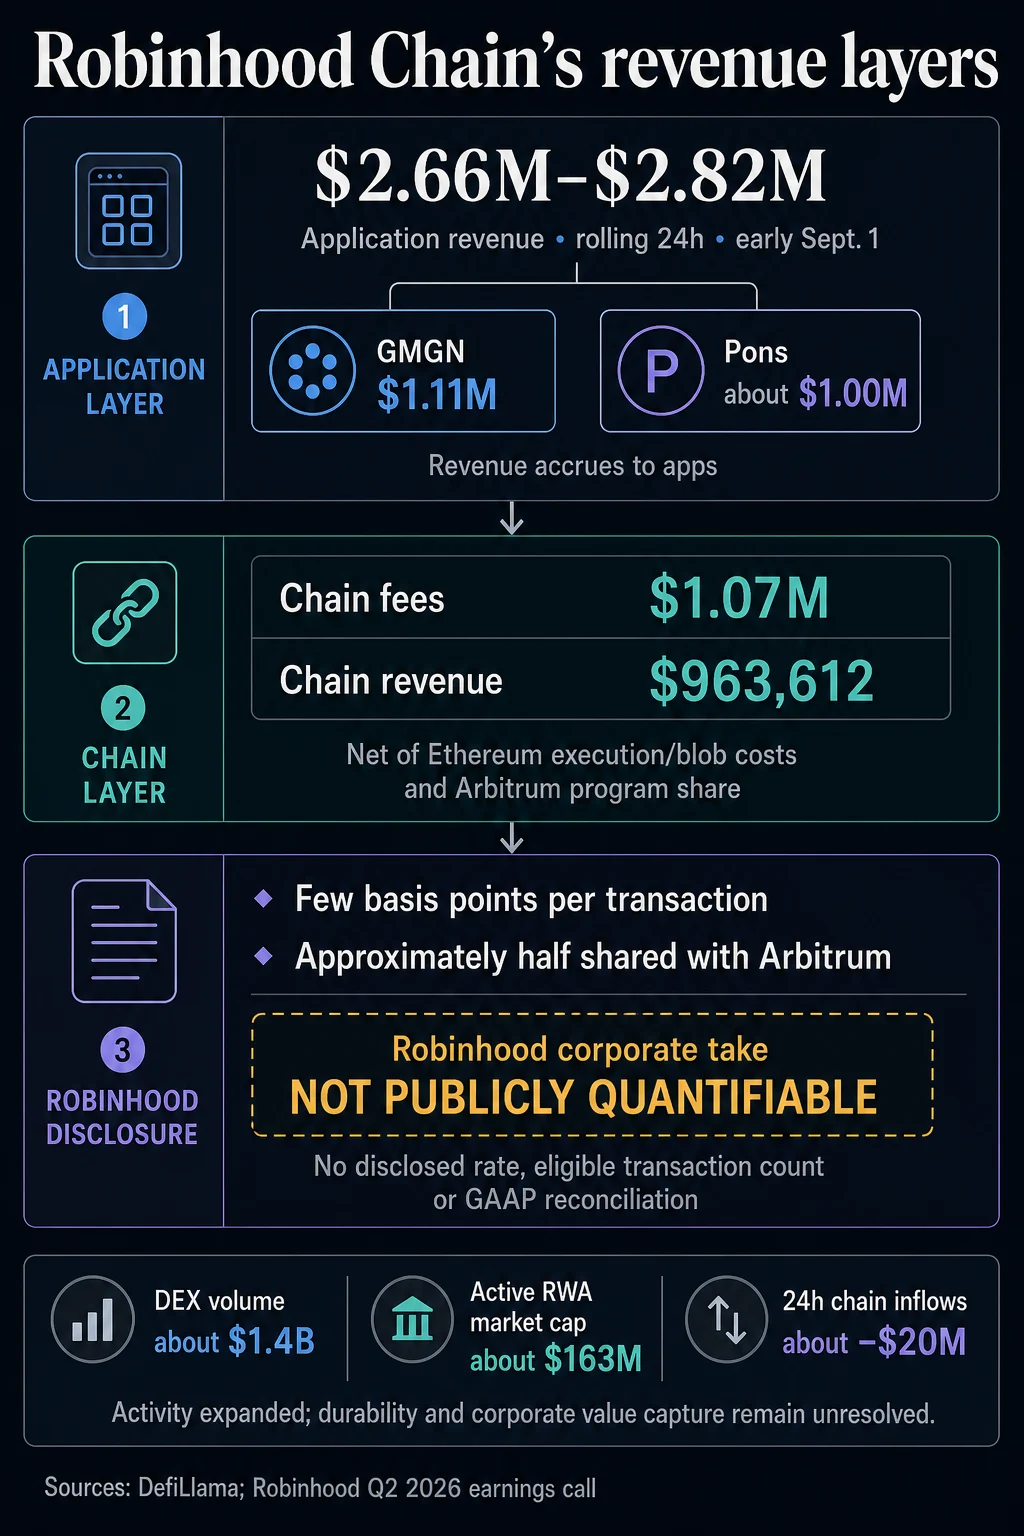
The digital asset ecosystem surrounding Robinhood Chain witnessed a significant surge in activity during a rolling 24-hour window early on September 1, 2024. According to data tracked by industry aggregators, application revenue on the network reached a peak between $2.66 million and $2.82 million. While these figures represent a substantial milestone for the platform’s burgeoning decentralized finance (DeFi) ecosystem, they highlight a persistent challenge for analysts and investors: the lack of a clear, disclosed mechanism to translate on-chain activity into Robinhood Markets, Inc.’s (HOOD) corporate GAAP revenue.
This surge in activity underscores the growing adoption of Robinhood’s blockchain infrastructure, yet the financial benefits to the parent company remain opaque. As the firm continues to pivot toward Web3 services, the disconnect between network metrics and corporate earnings reports remains a focal point for market observers seeking to quantify the actual value of Robinhood’s venture into the Layer-2 (L2) landscape.
Deconstructing the Revenue Layers of Robinhood Chain
To understand the implications of the $2.7 million figure, it is necessary to differentiate between the various tiers of revenue generated within a blockchain ecosystem. Data provided by DefiLlama, a leading decentralized finance analytics platform, categorizes these earnings into three distinct layers: application revenue, chain revenue, and chain fees.
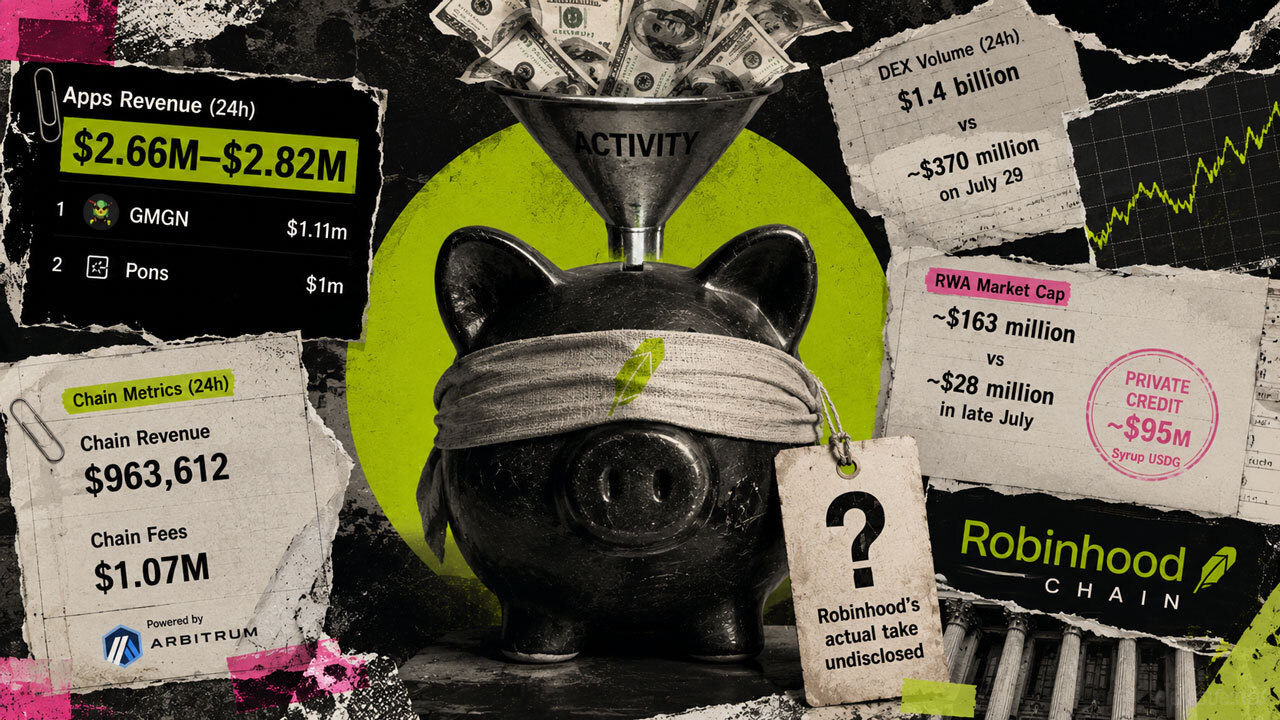
During the period in question, while application-level revenue hovered near $2.8 million, the specific "chain revenue" was recorded at approximately $963,612, derived from a total of $1.07 million in chain fees. The distinction is critical: application revenue belongs to the developers and protocols operating on top of the chain—such as trading bots and token launchpads—whereas chain revenue refers to the funds collected by the network sequencer or the entity managing the infrastructure.
Despite these granular figures, public financial records provide no definitive formula to bridge these on-chain metrics to Robinhood’s corporate accounting. In traditional finance, revenue recognition is strictly governed by GAAP (Generally Accepted Accounting Principles). In the context of Robinhood Chain, the company has yet to provide a public reconciliation that explains how much of the "chain revenue" or "fees" ultimately settles as net income or top-line revenue for the corporation after operational costs.
The Drivers of Growth: Trading Bots and Launchpads
The primary beneficiaries of the $2.7 million windfall were not the network operators, but rather the specific decentralized applications (dApps) that facilitate high-frequency activity. Analysis of the revenue distribution reveals a concentrated interest in speculative tools and early-stage token deployments.
- GMGN (Trading Bot): Leading the pack was the trading bot GMGN, which captured approximately $1.11 million in revenue over the 24-hour period. Trading bots have become a staple of modern L2 ecosystems, allowing users to execute rapid-fire trades, "snipe" new token launches, and manage portfolios with greater automation than traditional interfaces allow.
- Pons (Token Launchpad): Ranking second was the token launchpad Pons, which generated roughly $1 million in revenue. The prominence of a launchpad suggests that Robinhood Chain is increasingly being used as a staging ground for new digital assets, mirroring the "meme coin" and micro-cap token cycles seen on other networks like Solana and Base.
- Uniswap (Protocol Fees): While GMGN and Pons led in direct revenue, Uniswap remained the dominant force in terms of protocol fees. As the primary decentralized exchange (DEX) for the network, Uniswap’s high fee generation indicates deep liquidity and high volume, even if the protocol’s internal fee-sharing model differs from that of a standalone bot or launchpad.
Corporate Monetization and the Arbitrum Connection
Robinhood’s executive leadership has addressed the monetization of its blockchain ventures, albeit in broad strokes. During the company’s second-quarter earnings call, Chief Financial Officer Shiv Verma provided some insight into the revenue model for Robinhood Chain. Verma noted that the company earns "a few basis points" per transaction. Crucially, he revealed a revenue-sharing agreement where approximately half of these earnings are shared with Arbitrum, the technology provider upon whose stack the Robinhood Chain is built.
Verma’s emphasis was on the number of transactions rather than total transaction volume. This distinction is vital for L2 economics; since L2s profit from the spread between the fees they charge users and the "rent" they pay to the Layer-1 (Ethereum) for data availability, high transaction counts are often more lucrative for the sequencer than a few large-value transfers.
However, the company has not disclosed the precise rate of these basis points, the specific count of eligible transactions, or the exact fee base used for calculations. Furthermore, DefiLlama’s definition of the $963,612 "chain revenue" figure accounts for gas revenue remaining after Ethereum execution costs, "blob" (EIP-4844) costs, and the share owed to the Arbitrum Expansion Program. This leaves a significant portion of the financial picture to estimation rather than audited fact.
Comparative Growth: July vs. September
To assess the trajectory of Robinhood Chain, a comparison with previous months is necessary. The growth in network activity between late July and early September has been exponential in several key areas:
- DEX Volume: Rolling 24-hour decentralized exchange volume on the network reached approximately $1.4 billion during the September surge. This represents a massive increase from the $370 million recorded on July 29.
- Real-World Assets (RWA): The market capitalization of active real-world assets on the chain rose from nearly $28 million in late July to approximately $163 million by September.
- Asset Composition: A significant driver of this RWA growth is Syrup USDG, a private credit asset that accounts for roughly $95 million of the total. This indicates that while the "Robinhood" brand is the draw, the growth is being fueled by external DeFi protocols rather than just Robinhood-issued products or stock-tokenization.
Despite these positive growth signals, some indicators suggest a degree of volatility. For instance, while DEX volume and RWA value surged, the 24-hour window also saw negative chain inflows of approximately $20 million. This suggests that while existing capital within the ecosystem is being cycled aggressively (leading to high fees and revenue), there was a net exit of liquidity from the chain during that specific interval.

Implications for Robinhood’s Long-Term Strategy
The recent performance of Robinhood Chain highlights a strategic shift for the brokerage. By fostering an ecosystem where third-party apps like GMGN and Pons can thrive, Robinhood is positioning itself as a "platform" rather than just a "broker." This mirrors the strategy of Coinbase with its "Base" network, which has successfully migrated a portion of retail trading activity into a decentralized environment where the parent company controls the infrastructure.
However, the "Robinhood Chain" remains in a nascent stage where speculative activity—driven by trading bots and launchpads—outpaces institutional or long-term investment utility. For Robinhood to convert this $2.7 million "activity day" into recurring, predictable corporate revenue, it must find a way to:
- Increase the "Take Rate": As the ecosystem matures, Robinhood may need to refine its fee-sharing agreement with Arbitrum or introduce proprietary services that capture a larger share of the application-level revenue.
- Expand RWA Offerings: While Syrup USDG is a successful third-party asset, the true potential for Robinhood lies in tokenizing the traditional assets it already manages—such as equities or ETFs—which would create a more direct bridge to its core business.
- Enhance Financial Transparency: As the blockchain division becomes a more significant part of the HOOD story, investors will likely demand clearer reconciliation between on-chain data (like that provided by DefiLlama) and the quarterly earnings reports.
Conclusion: A Growing Moat with Unclear Yields
The $2.7 million generated by Robinhood Chain apps in a single day is an undeniable sign of life for the network. It proves that Robinhood has successfully attracted a segment of the "degen" and DeFi-native audience that typically frequents chains like Solana or Base. The massive jump in DEX volume and RWA market cap since July suggests that the chain is gaining momentum as a hub for decentralized finance.
Nevertheless, for the time-being, the "flood of activity" remains largely decoupled from Robinhood’s bottom line. The majority of the revenue is being captured by independent developers and the Arbitrum ecosystem. For shareholders, the value of Robinhood Chain currently lies in its potential as a future earnings base rather than its current contribution to the company’s cash flow. Until Robinhood provides a clearer bridge between these eye-catching on-chain metrics and its GAAP financial statements, the true profitability of its blockchain venture will remain one of the most intriguing mysteries in the fintech sector.