Layla Zulfa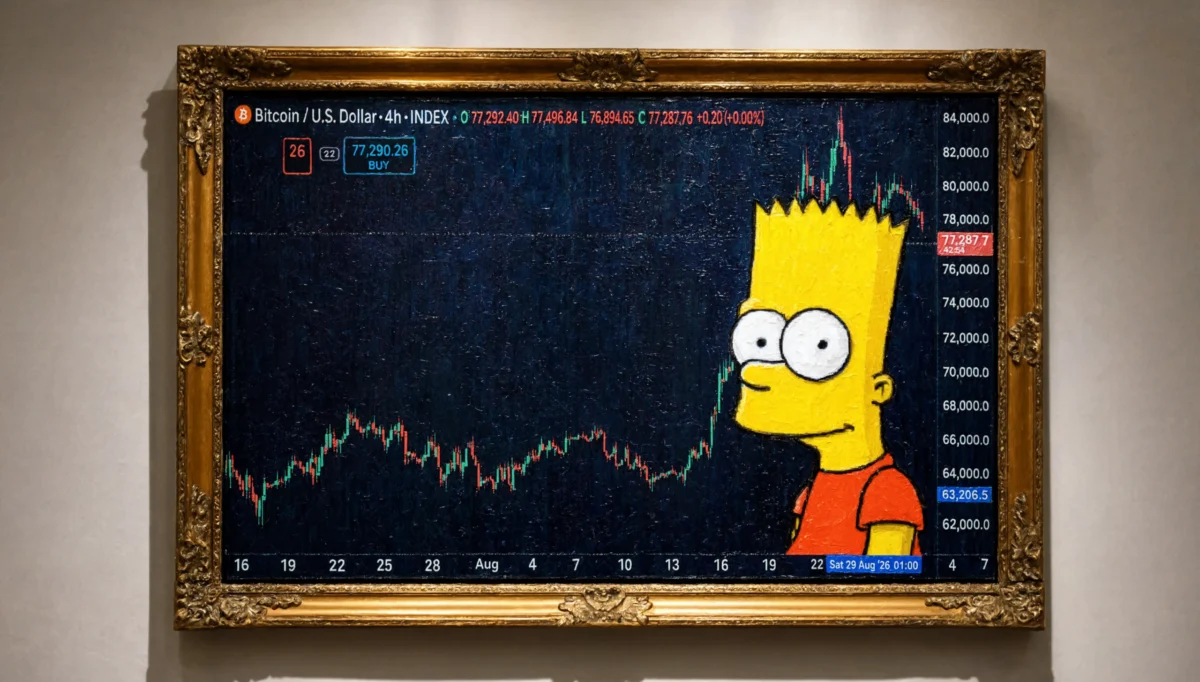
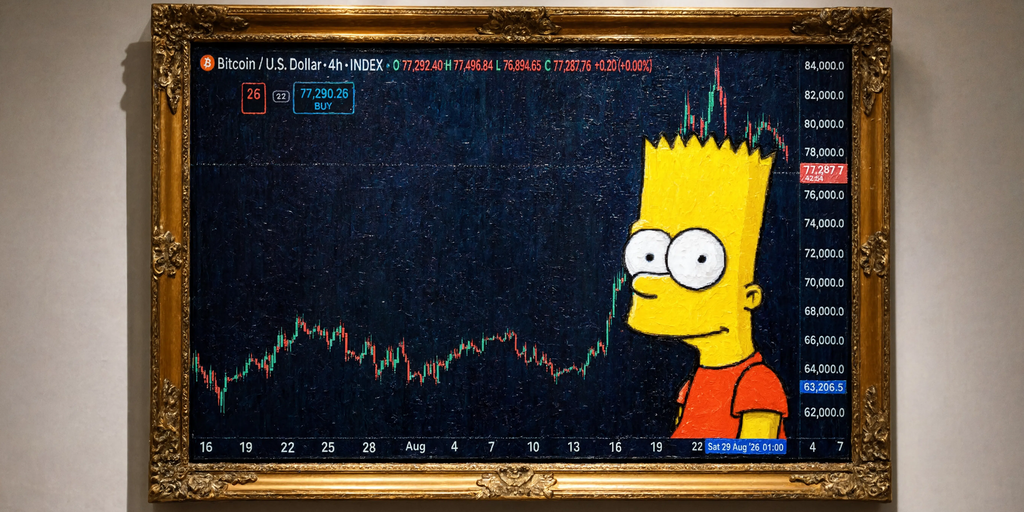
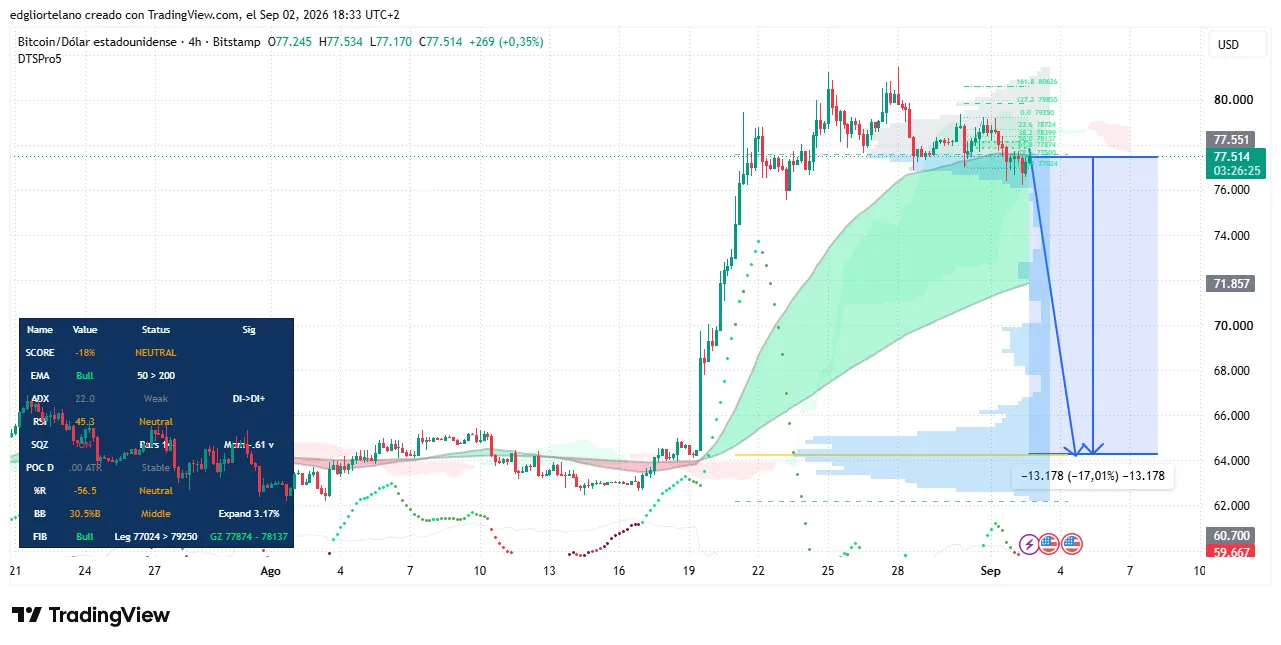
The digital asset market is currently navigating a period of heightened scrutiny as Bitcoin (BTC) exhibits a chart formation colloquially known among traders as the Bart Simpson pattern, following a volatile August performance that saw the cryptocurrency surge nearly 25% in value. After climbing from a base of approximately $64,420 on August 19 to a peak of nearly $80,700 by August 25, Bitcoin has entered a phase of horizontal consolidation and gradual cooling, with recent trading activity centering around the $77,470 mark. This specific price trajectory—characterized by a vertical ascent, a period of flat, choppy consolidation, and the potential for a symmetrical sharp decline—has reignited discussions regarding the technical health of the market and the likelihood of a significant "giveback" of recent gains.
The Anatomy of the Bart Simpson Pattern
The Bart Simpson pattern is a distinctive chart formation that has circulated within cryptocurrency trading circles since approximately 2015. Unlike traditional technical indicators such as the Relative Strength Index (RSI) or Moving Average Convergence Divergence (MACD), the Bart pattern is a nickname for a specific type of market behavior often attributed to low liquidity or concentrated institutional movements. The formation is complete when an asset experiences a rapid price spike, followed by a period of "sideways chop" that resembles the jagged hair of the cartoon character Bart Simpson, and concludes with a sudden reversal that returns the price to its original starting point.
In the current context, the pattern’s "left side" and "top" have already formed. The sharp rally in the third week of August provided the initial vertical move, while the subsequent week of trading between $77,000 and $80,000 created the flat, serrated top. Market participants are now focused on whether the "right side" of the pattern—a flash crash—will materialize, potentially driving prices back toward the $64,000 level.
Technical Indicators: A Mixed Diagnostic
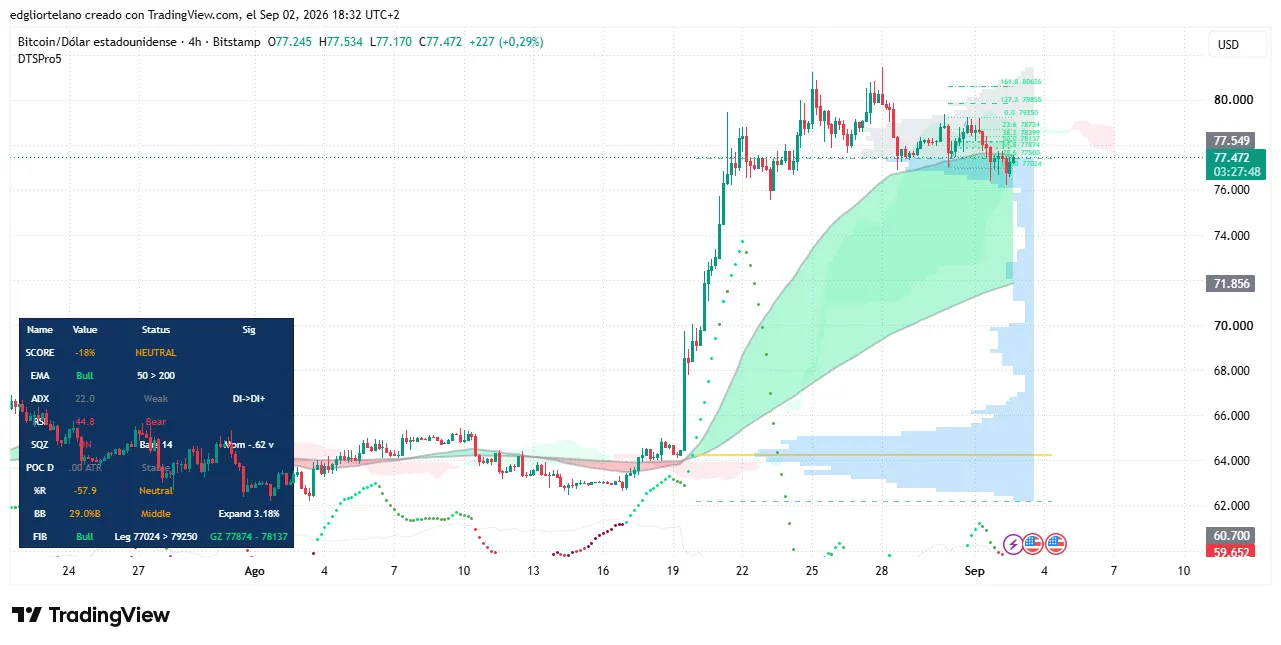
Despite the visual resemblance to a bearish reversal pattern, a deeper dive into the four-hour technical charts reveals a more nuanced and less definitive outlook. Analysts utilize several key metrics to determine if a breakdown is imminent or if the current consolidation is merely a healthy pause in a broader bullish trend.
Relative Strength Index (RSI) and Momentum
The Relative Strength Index (RSI), which measures the speed and change of price movements on a scale of 0 to 100, currently sits at 44.8 for Bitcoin. In technical analysis, an RSI above 70 indicates overbought conditions, while an RSI below 30 suggests an asset is oversold. A reading of 44.8 leans slightly bearish but remains well within the neutral zone. This suggests that while momentum has cooled since the August peak, the market is not yet in the "danger zone" typically associated with a systemic breakdown or a panic-driven flash crash.
Average Directional Index (ADX)
The Average Directional Index (ADX) is employed to gauge the strength of a trend regardless of its direction. Currently, Bitcoin’s ADX stands at 22. Professional traders generally consider a reading above 25 as a signal of a strong, established trend. At 22, the ADX indicates that the market is currently "ranging" or "chopping" rather than trending. This lack of trend strength explains the sideways movement observed over the past week and suggests that neither bulls nor bears have seized definitive control of the price action.
Squeeze Momentum and Volatility Compression
Perhaps the most significant technical signal currently observed is the Squeeze Momentum indicator. This tool flags periods when volatility is compressing, which often serves as a precursor to a violent breakout in either direction. For Bitcoin, this indicator is currently flashing a bearish signal with falling momentum. The presence of a "compression zone" implies that a major move is forthcoming. If the breakout is to the downside, it would complete the Bart Simpson pattern; conversely, an upside break would invalidate the bearish thesis and confirm the continuation of the August rally.
Moving Averages and Structural Health
From a structural standpoint, the market remains technically bullish on longer timeframes. The 50-period exponential moving average (EMA) continues to trade above the 200-period EMA. This "golden cross" structure is a textbook definition of a bullish trend. As long as the shorter-term average remains above the longer-term average, many analysts argue that a full Bart Simpson reversal is unlikely, as the underlying price floor remains elevated.
The Catalyst Requirement: What Triggers a Flash Crash?
For a Bart Simpson pattern to reach completion, the reversal must occur with a velocity similar to the initial spike. In Bitcoin’s current setup, a genuine flash crash would require the asset to surrender its entire August gain—roughly a 17% decline—within a matter of hours or days rather than weeks.
Market historians point to previous events, such as the $19 billion liquidation wipeout in October 2025, as evidence of how these moves occur. Such events are rarely the result of organic selling; instead, they are driven by cascading leveraged liquidations. When the price hits a critical threshold, automated sell orders for leveraged positions are triggered, which in turn drives the price lower, triggering further liquidations.
The critical "inflection point" for the current chart is identified at $75,800. A decisive break below this support level could provide the necessary momentum for a liquidation cascade. Conversely, if Bitcoin maintains its position above $75,800, the bearish Bart Simpson setup would likely be invalidated, shifting the focus back to potential resistance at the $80,700 mark.
Macroeconomic Headwinds and "Red September"
The technical debate is occurring against a backdrop of seasonal and macroeconomic challenges. Historically, September is the most difficult month for Bitcoin. Data since 2013 shows that Bitcoin has closed in the red in eight of the last 13 Septembers, with an average loss of nearly 3%. This seasonal phenomenon, known as "Red September," often sees reduced trading volume and a general "risk-off" sentiment among global investors.
Federal Reserve Policy and Interest Rates
The primary external driver for the current market caution is the upcoming Federal Reserve meeting scheduled for September 15-16. According to the CME FedWatch tool, there is currently a 64% probability that the Fed will implement a rate hike. Higher interest rates typically exert downward pressure on risk assets like cryptocurrencies, as the cost of borrowing increases and investors seek the relative safety of yield-bearing assets such as government bonds.
Institutional Outflows and Geopolitical Pressures
Institutional sentiment appears to be cooling in tandem with the price. Spot Bitcoin ETFs recorded a net outflow of approximately $236 million on a single Tuesday in early September, signaling a temporary retreat by large-scale investors. Furthermore, geopolitical tensions are contributing to market instability. Recent military strikes involving the U.S. and Iran near the Strait of Hormuz have pushed oil prices into the low $90s per barrel. Rising energy costs contribute to inflationary pressures, which in turn strengthens the Federal Reserve’s case for maintaining or increasing interest rates, creating a challenging environment for crypto-assets.
Alternative Scenarios: The Gradual Correction
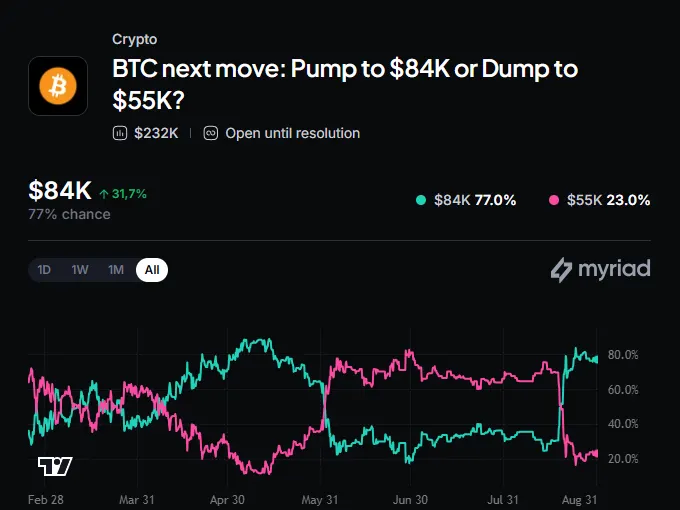
While the Bart Simpson pattern captures the imagination of the trading community due to its dramatic nature, many analysts suggest a second, more likely bearish path: a structural correction. Rather than a sudden 17% flash crash, this scenario involves a gradual downward channel.
By drawing a descending trendline from the August high of $80,626, some models predict a "slow bleed" that could see Bitcoin drift toward the $62,000 area over a period of eight weeks, potentially bottoming out in late October. This type of movement would be characterized by "lower highs" and "lower lows," a pattern Bitcoin has displayed previously, notably during the compressive wedge formations of late 2025 and early 2026.
A structural correction is mechanically different from a Bart Simpson pattern. While the price target might be similar, the "slow bleed" is driven by a lack of buying interest and seasonal drag, whereas the Bart Simpson pattern is driven by market mechanics and forced liquidations. For long-term holders, a gradual correction is often viewed as less damaging than a flash crash, as it allows for a more orderly repricing of the asset.
Broader Impact and Market Implications
The resolution of the current price pattern will have significant implications for the remainder of the year. If Bitcoin manages to hold its ground and break above the $80,700 resistance, it would signal a robust appetite for risk despite the "Red September" historical trend. Such a move would likely be interpreted as a sign that Bitcoin is increasingly decoupling from traditional seasonal cycles.
However, if either the flash crash or the gradual correction occurs, the market will likely enter a period of consolidation that could last through the end of the year. Investors are closely watching the $75,800 support level as the primary indicator of short-term direction.
In conclusion, the Bitcoin market is at a crossroads. The visual allure of the Bart Simpson pattern provides a convenient shorthand for current fears, but the underlying data presents a more complex picture. Between the looming Federal Reserve decision, institutional ETF outflows, and the historical weight of September, the path of least resistance currently appears to be downward or sideways. Whether that move happens in a single "Bart-like" candle or a multi-week grind will depend on the interplay between leveraged market participants and the broader macroeconomic environment. As of early September, the market remains in a state of high-tension equilibrium, awaiting a definitive catalyst to break the current "compression zone."