James Watt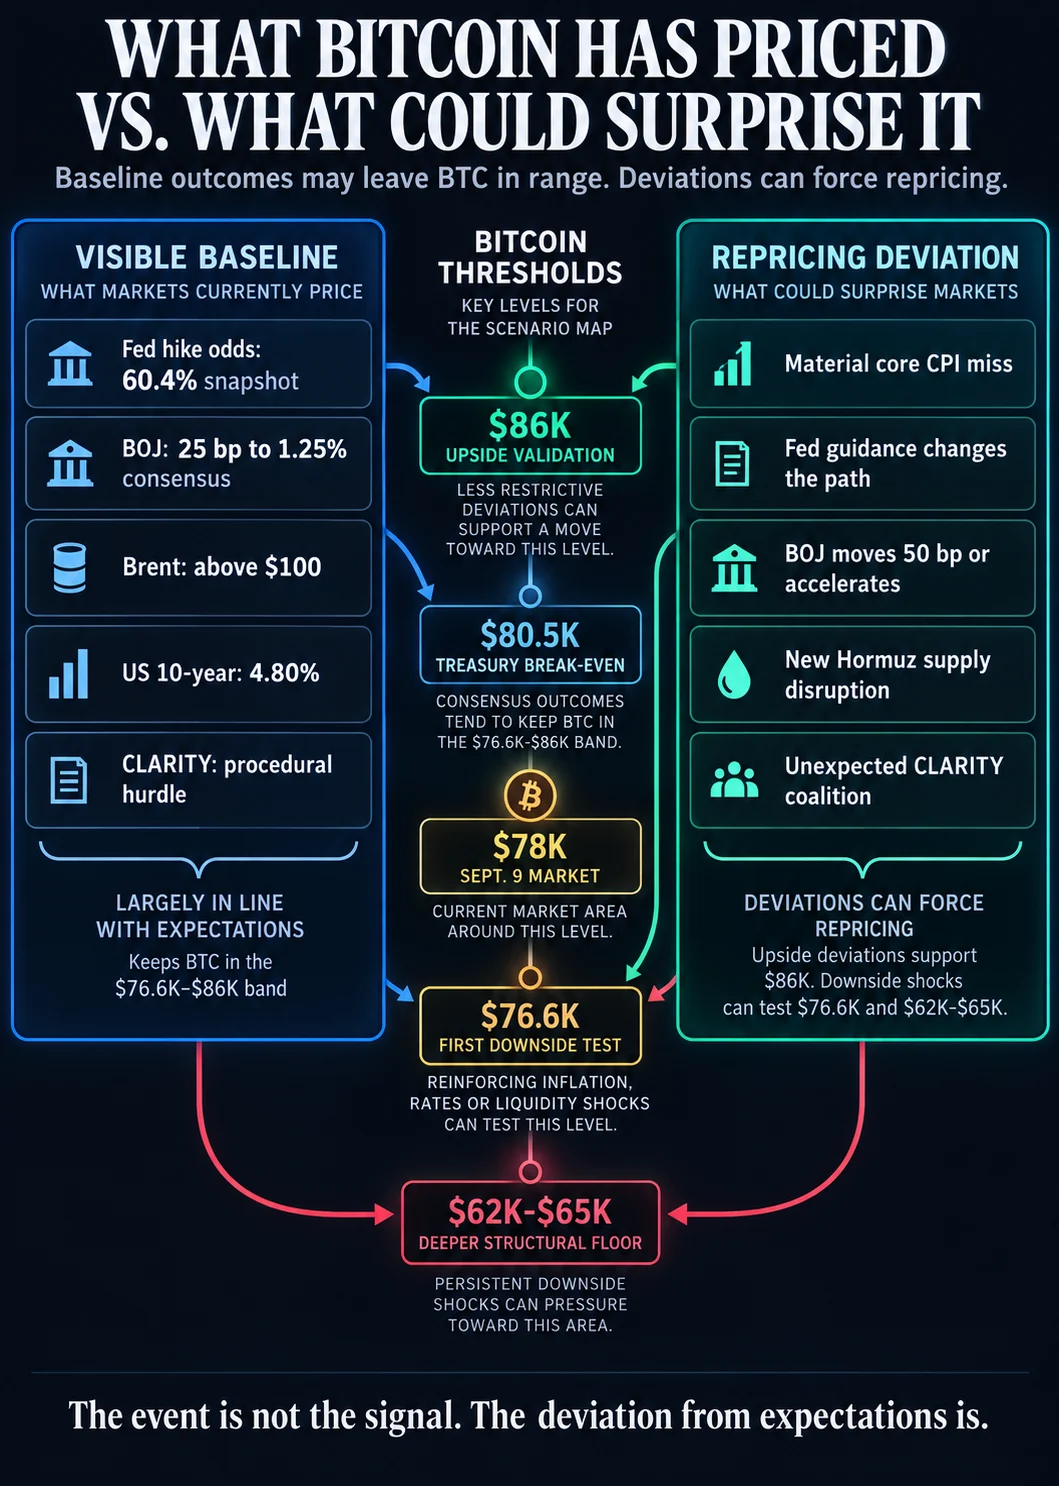
Bitcoin is currently navigating a precarious "decision zone," where its price stability depends on whether upcoming macroeconomic events align with current market expectations or deliver a disruptive shock. As global markets prepare for a series of high-impact catalysts—including the release of U.S. inflation data, a Federal Reserve interest rate decision, and shifting policy from the Bank of Japan—the leading cryptocurrency remains positioned between critical technical floors and significant overhead supply. To maintain its current trajectory, Bitcoin requires the outcomes of these events to be no worse than the assumptions already priced into Treasury yields, oil prices, and policy-probability markets.
The current market environment is characterized by a complex interplay of rising energy costs and tightening monetary conditions. Brent crude oil has recently surged above $100 per barrel, while the U.S. 10-year Treasury yield reached 4.80% as of September 8. Despite these headwinds, Bitcoin has managed to stay above the "True Market Mean" identified by Glassnode at $76,600. However, it remains just below a dense cluster of cost-basis and liquidation levels that represent a major psychological and technical hurdle for bulls.
The Technical Landscape: Support and Resistance Thresholds
According to recent data from Glassnode’s September 9 report, the price range between $83,000 and $86,000 serves as a critical overhead supply band. This region is particularly significant because it marks the convergence of long-term-holder cost bases, modeled short-liquidation exposure, and the break-even levels for U.S. spot exchange-traded funds (ETFs). On-chain analysis reveals that over 1 million BTC was acquired within this price range, suggesting that a move into this territory will face significant selling pressure as investors look to exit at break-even.
Furthermore, the modeled short-liquidation shelf between $82,000 and $86,000 grew by 21% following August 19, indicating an increase in bearish bets that could be squeezed if Bitcoin finds sufficient upward momentum. For corporate treasuries, the break-even point sits slightly lower, near $80,500, creating an intermediate level of resistance that the market must overcome before challenging the $86,000 ceiling.
On the downside, the True Market Mean of $76,600 serves as the immediate line of defense. A failure to hold this level would signal that the floor under the recent rally is weakening. Below that, a deeper structural accumulation floor exists between $62,000 and $65,000. This lower band is aligned with modeled long-liquidation exposure around $60,000 to $63,000, marking the final support zone before a potential regime shift into a bearish cycle.
Chronology of Upcoming Macroeconomic Catalysts
The market’s immediate direction will likely be determined by a sequence of events scheduled for mid-September. Each of these events has the potential to alter the "information set" upon which traders base their valuations.
September 11: U.S. Consumer Price Index (CPI) Release
The Bureau of Labor Statistics is scheduled to publish August inflation data at 8:30 a.m. ET. This report is perhaps the most anticipated data point for the month, as it will directly influence the Federal Reserve’s next move. In July, headline CPI stood at 3.4% year-over-year, with core inflation at 2.5%. A "hot" reading—particularly in the core sector—could force traders to price in a more aggressive policy path, potentially pushing Bitcoin to test the $76,600 support level. Conversely, a cooler-than-expected print could lower Treasury yields and provide the liquidity needed for Bitcoin to challenge the $80,500 corporate break-even level.
September 15–16: Federal Open Market Committee (FOMC) Meeting
The Federal Reserve’s policy-setting committee will meet to decide the fate of U.S. interest rates. Following a mixed August jobs report, the CME FedWatch Tool indicated a 60.4% probability of a 25-basis-point hike, up from 57% a week prior. This contrasts with a Reuters poll of 93 economists, where 65 expected the Fed to hold rates steady in the 3.50% to 3.75% range. The primary risk for Bitcoin is a "hawkish hike"—a rate increase paired with guidance suggesting that the tightening cycle will last longer than previously anticipated.
September 17–18: Bank of Japan (BoJ) Policy Meeting
The Bank of Japan is expected to deliver a conventional 25-basis-point increase, bringing its policy rate to 1.25%. While this is the reported consensus, any move toward a 50-basis-point hike or guidance pointing toward rapid tightening could have global repercussions. Such a move would likely accelerate the appreciation of the Japanese Yen, potentially triggering a "carry trade" unwind that could drain liquidity from risk assets, including Bitcoin.
September 15: Legislative Action on the CLARITY Act
While secondary to monetary policy, the U.S. Senate is expected to take action on the CLARITY Act. The official schedule describes this as a cloture motion to proceed to H.R. 3633. While the bill’s final passage remains uncertain, an unexpected coalition of support could shift the regulatory outlook for digital assets in the United States, providing a backdrop of policy uncertainty.

Analyzing Market Sentiment and Holder Behavior
One of the most striking aspects of the current market is the divergence between the alarming macro backdrop and the relatively calm behavior of on-chain participants. Despite the threat of higher rates and $100 oil, Bitcoin holders are not showing signs of urgent distribution.
Glassnode’s seven-day Sell-Side Risk Ratio, which measures the balance between realized profit/loss and the total realized cap, fell from an August peak of 16 basis points to just 7 basis points per day. This suggests that investors are increasingly hesitant to realize profits at current levels, preferring to wait for further price discovery. Additionally, the share of realized profit held by long-term holders has dropped from 88% to 47% over the same period, indicating that the market is not currently undergoing the heavy distribution phase typically seen at local price tops.
This lack of "panic" spending suggests that the market has, for the most part, absorbed the baseline versions of several visible threats. However, this resilience is fragile and depends heavily on the upcoming data prints remaining within expected bounds.
The Energy Channel: Oil Prices and Geopolitical Risks
The price of energy acts as a stealth inflation driver that can force central banks into a more hawkish stance. Brent crude’s move above $100 on September 9, combined with reports that flows through the Strait of Hormuz have fallen below 2 million barrels per day, presents a significant risk.
The Strait of Hormuz is a critical artery for global oil supply, and any further disruption—whether through geopolitical conflict or infrastructure failure—would represent "new information" that the market has not yet fully priced in. If energy prices continue to rise alongside a hot CPI print, the narrative of "higher for longer" interest rates will gain significant traction, putting immense pressure on Bitcoin’s $76,600 support level.
Potential Scenarios and Market Implications
The interplay of these variables suggests three primary paths for Bitcoin in the coming weeks:
1. The Less-Restrictive Path (Bullish)
In this scenario, August CPI data comes in lower than expected, prompting the Federal Reserve to hold rates steady with "dovish" guidance. Simultaneously, the Bank of Japan delivers only the anticipated 25-basis-point move, and geopolitical tensions in the Gulf stabilize, leading to a cooling of oil prices. Under these conditions, Bitcoin would likely clear the $80,500 resistance and attempt a sustained move above the $86,000 wall. Success here would signal a regime shift toward easier financial conditions.
2. The Consensus Path (Neutral)
If CPI data aligns with expectations and central banks follow through with anticipated moves without hawkish surprises, the market will likely remain in its current regime. Bitcoin would continue to trade within the range defined by the $76,600 mean and the $83,000–$86,000 ceiling. In this "wait-and-see" environment, the market would continue to absorb overhead supply without a definitive breakout in either direction.
3. The Downside Path (Bearish)
The most significant risk involves a "perfect storm" of shocks: a hot inflation report, a hawkish Fed hike, faster-than-expected tightening from the BoJ, and a further spike in oil prices. This combination would likely drive Treasury yields higher and tighten global funding conditions. In such a scenario, Bitcoin’s first structural test would be at $76,600. A breach of this level would likely lead to a rapid descent toward the $62,000–$65,000 accumulation floor as long-liquidation events are triggered.
Conclusion
Bitcoin stands at a crossroads, with its immediate future tied to the stability of the global macroeconomic framework. While on-chain metrics suggest a lack of aggressive selling, the overhead supply between $83,000 and $86,000 remains a formidable barrier. The market has shown resilience near $78,000, indicating that it has successfully absorbed the baseline threats of $100 oil and elevated interest rates. However, the true test lies in the "repricing deviations"—the surprises that fall outside of the current market consensus. As the September 11 inflation data and the September 16 Fed decision approach, the digital asset market remains on high alert, waiting to see if the macro environment will provide the fuel for a breakout or the pressure for a breakdown.