James Watt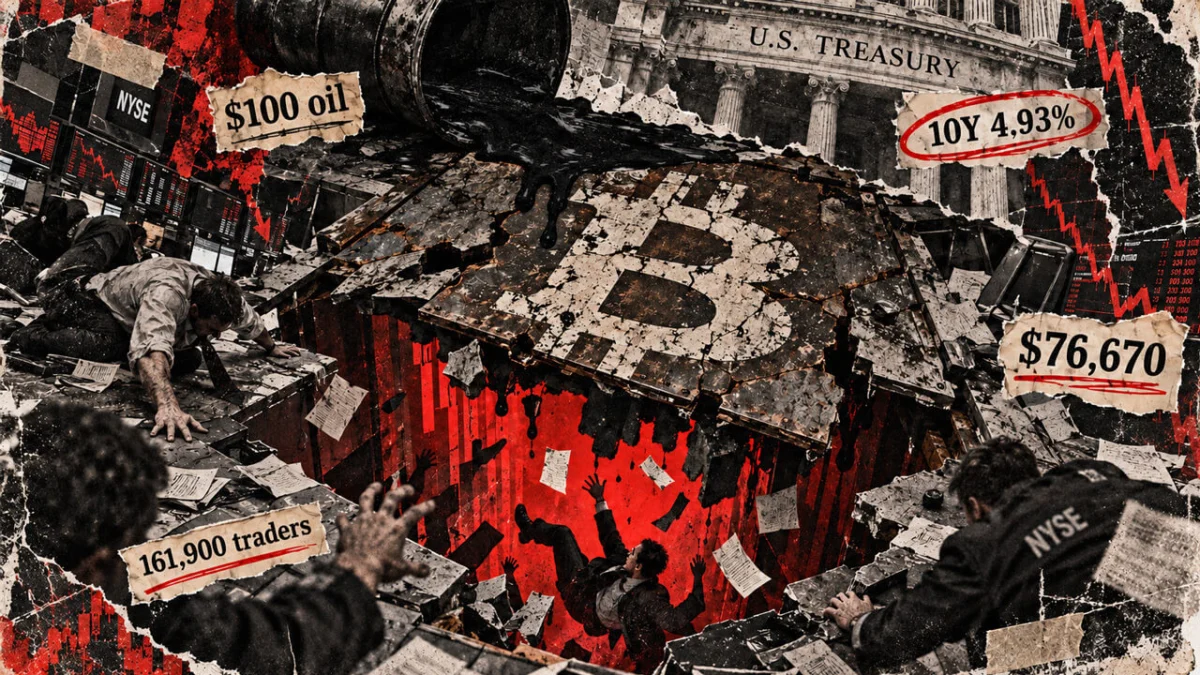
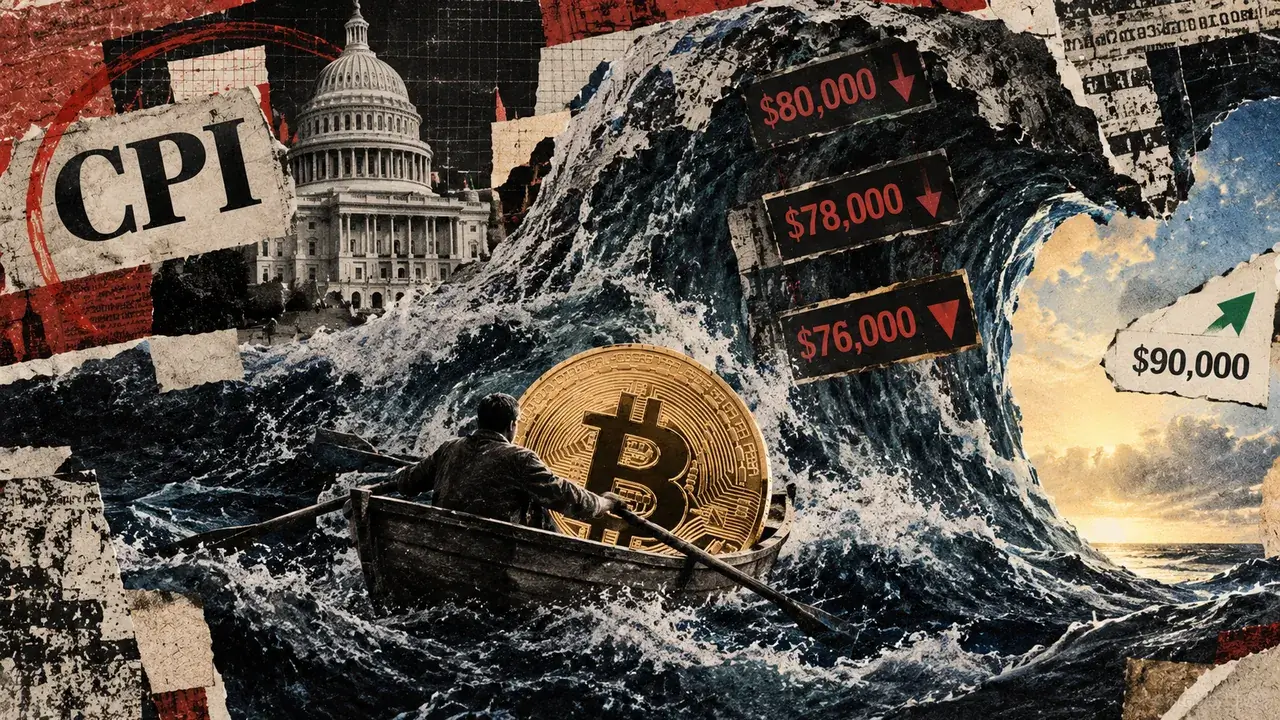
The global financial landscape underwent a significant shift on September 10 as a confluence of surging energy prices, a rout in the sovereign bond market, and accelerating producer price inflation sent shockwaves through both traditional and digital asset classes. Bitcoin, which had recently been consolidating near its all-time highs, tumbled below the critical $77,000 support level, reaching an intraday low of $76,676.07. This downward movement in the cryptocurrency sector mirrored a broader retreat in risk assets, with Nasdaq 100 futures sliding 0.7% as investors grappled with the reality of "higher for longer" interest rates and a looming energy-driven inflation spike.
The primary catalyst for the day’s volatility was a dual-pronged pressure from the energy and debt markets. Crude oil prices surged past the psychological $100 per barrel threshold, while the 10-year Treasury yield climbed to 4.93%. Simultaneously, the 30-year Treasury yield touched 5.35%, marking its highest level in 19 years. These movements have drastically altered the calculus for the Federal Reserve’s upcoming policy meeting, with interest rate markets now pricing in a 76% probability of a quarter-point hike next week. The complexity of the current situation lies in the "lag effect" of official data; current inflation reports have yet to fully reflect the most recent jump in energy costs, leaving traders to front-run an anticipated second wave of inflationary pressure.
The Energy Shock: Oil’s Ascent Above One Hundred Dollars
The resurgence of oil prices has emerged as the most immediate threat to global price stability. West Texas Intermediate (WTI) crude rose more than 4% on September 10, breaking above $100 a barrel for the first time since May. Brent crude, the international benchmark, followed suit, climbing past $105. This rally is not merely a technical breakout but is rooted in escalating geopolitical tensions and supply chain vulnerabilities. Recent attacks on critical shipping routes in the Middle East have renewed fears of a prolonged supply disruption, forcing a risk premium back into the energy markets. Since its early-August lows, Brent has surged by more than 30%, a move that threatens to reverse the progress made by central banks in taming headline inflation.
Economists are particularly concerned that the timing of this surge creates a "blind spot" in official government statistics. The U.S. Bureau of Labor Statistics (BLS) reported that producer prices rose 0.4% in August, bringing the annual increase to 5.4%, up from 4.8% in July. While Core PPI—which excludes volatile food and energy costs—increased by a modest 0.2%, the figure was largely ignored by a bond market focused on the secondary effects of the energy spike. Joseph Brusuelas, principal and chief economist at RSM US LLP, noted that the PPI sampling period concluded on August 11, meaning the data captured almost none of the recent explosive growth in crude, gasoline, and diesel prices.
Brusuelas provided a stark assessment of the underlying reality, suggesting that current diesel prices are economically equivalent to crude oil trading near $207 a barrel. This massive discrepancy suggests that wholesale prices and core inflation metrics will likely see a significant upward "catch-up" in the September and October reports. This realization has fortified the case for the Federal Reserve to maintain its hawkish stance at the September 15-16 meeting, regardless of the relative softness in previous "core" readings.
Sovereign Debt Markets Reach a Breaking Point
The turmoil in the energy sector has translated directly into a brutal selloff in the U.S. Treasury market. Investors are demanding significantly higher yields to compensate for the eroding purchasing power caused by inflation. The 10-year Treasury yield’s move toward 5% is being viewed by many analysts as a potential "breaking point" for equity valuations and speculative assets like Bitcoin. This climb persisted despite efforts by the U.S. Treasury Department to stabilize the market. On the day prior to the selloff, the Treasury tripled the size of its long-end buyback operation to as much as $6 billion, a move intended to provide liquidity to the 20-year and 30-year bond sectors.
However, the intervention failed to stem the tide. The 30-year yield’s rise to 5.35% came just ahead of a new Treasury auction, signaling that investors are hesitant to absorb more government debt at current prices. Brusuelas noted that the "confluence of inflation data, oil prices, and global central-bank policy" has made a test of the 5% level on the 10-year yield an "immediate offing." The market is now looking toward the upcoming Consumer Price Index (CPI) report on September 11 as the ultimate arbiter of yields. A "hot" CPI reading could push the 10-year yield well beyond 5%, potentially triggering a deeper liquidation event across all asset classes.
The pressure is not limited to the United States. The European Central Bank (ECB) also took decisive action on September 10, raising its deposit rate by 25 basis points to 2.5%. This was the ECB’s second hike of the year, prompted by the energy shock pushing euro-area inflation back above 3%. The ECB’s revised projections now see inflation averaging 2.5% in 2027, up from the 2.3% estimated in June. This global synchronized tightening of monetary policy is draining liquidity from the system, creating a difficult environment for cryptocurrencies that thrived during the era of low rates and quantitative easing.

Bitcoin and the Unwinding of Market Leverage
As the macro environment soured, the cryptocurrency market experienced a rapid and painful unwinding of leveraged positions. Bitcoin’s fall below $77,000 triggered a cascade of liquidations that caught many "long" traders off guard. According to data from CoinGlass, more than 161,900 traders were liquidated over a 24-hour window, with total forced position closures reaching approximately $568 million. Bitcoin-specific long positions accounted for $138 million of this total, while Ethereum traders saw $113 million in liquidations.
The intensity of the selling was most visible on major exchanges like Binance. CryptoQuant data revealed that Bitcoin "taker sell volume"—a metric representing aggressive selling in the perpetual swaps and spot markets—surged above $1.4 billion within a single hour. This spike occurred almost immediately following the release of the PPI data and the subsequent jump in Treasury yields. The sheer volume of selling suggests that large-scale derivatives traders were either forced out of their positions or were aggressively hedging against further downside.
This price action has pushed Bitcoin back into a critical "accumulation zone." On-chain data from Glassnode indicates that a significant amount of supply was recently acquired between the $76,000 and $82,000 price levels. This range now serves as a primary support cluster. Above this, a much larger "long-term-holder" block exists between $83,000 and $86,000, where over 1.07 million BTC were previously transacted. The fact that Bitcoin is now testing the lower bound of this recent recovery range is a bearish signal for short-term price action.
On-Chain Analysis and Support Floor Projections
The technical and on-chain outlook for Bitcoin has grown increasingly precarious. While the $76,000-$82,000 range offers some immediate cushion, a sustained break below this area would leave the asset vulnerable to a much deeper correction. Glassnode analysts have identified a more robust "accumulation floor" situated between $62,000 and $65,000. This deeper range represents a historical cost-basis for many investors who entered the market during the earlier stages of the current cycle.
If the macroeconomic selloff persists—driven by 10-year yields exceeding 5% and oil remaining above $100—Bitcoin could be forced to test these deeper support levels. The "Wall Street rhythm" that has increasingly dictated Bitcoin’s price movements suggests that the asset is no longer decoupled from traditional finance. Instead, it is behaving as a high-beta version of the Nasdaq, sensitive to every tick in the 10-year Treasury and every headline regarding Federal Reserve policy.
The upcoming September 11 CPI report is being viewed as the next "make or break" moment for Bitcoin’s support. Economists are forecasting headline consumer prices to rise 0.4% in August, with core prices increasing by 0.2%. However, as with the PPI data, these figures will only partially capture the energy surge. The danger for Bitcoin bulls is that even a "meeting expectations" report might not be enough to stop the bleeding if the market remains focused on the "shadow inflation" currently building in the energy sector.
Broader Implications for Global Markets
The events of September 10 underscore a fundamental shift in the global economic narrative. The "soft landing" scenario, which many market participants had priced in during the early summer, is being challenged by the reality of sticky inflation and rising borrowing costs. The surge in the two-year Treasury yield to 4.50%—nearly a full percentage point above the Fed’s current target range—suggests that the market is preparing for a significantly more aggressive central bank than previously anticipated.
For the cryptocurrency industry, this environment represents a "stress test" of its maturity. The massive liquidations on Binance and other platforms highlight the continued prevalence of high leverage, which exacerbates volatility during macro-driven selloffs. Furthermore, the correlation between Bitcoin and the bond market suggests that the "digital gold" narrative is being overshadowed by its role as a liquidity sensitive asset.
As traders look toward the Federal Reserve’s decision next week, the focus will remain on the interplay between energy prices and monetary policy. If the Fed chooses to hike rates again, it will be a clear signal that the central bank is willing to risk a slowdown in economic growth to prevent a second-wave inflation spiral. For Bitcoin, which has thrived on the expectation of a "Fed pivot," this reality could mean a prolonged period of consolidation or further downside until the macro picture stabilizes. The market is no longer just watching charts; it is watching the price of a barrel of oil and the yield on a 10-year bond, recognizing that in the current economy, all roads lead back to the cost of energy and the cost of capital.