Bitcoin surged to the $70,000 threshold during Wednesday’s New York trading session, marking a significant milestone in a week characterized by renewed bullish momentum and substantial institutional interest. This price action comes as market participants focus on critical resistance levels and a massive cluster of sell-side liquidity positioned just above current market prices. As the leading cryptocurrency by market capitalization attempts to solidify its position above previous resistance zones, technical analysts and institutional data suggest that the market may be on the verge of a significant volatility event that could propel prices toward the $80,000 mark.
The primary catalyst for this midweek rally appears to be a combination of aggressive institutional accumulation through U.S.-based spot Bitcoin exchange-traded funds (ETFs) and a tactical "liquidity hunt" by large-scale traders. For the bulls to maintain this trajectory, however, the market must navigate several technical hurdles, most notably the requirement to close the weekly candle above the $68,000 level. This specific price point represents a historical pivot that has frequently dictated the long-term trend of the digital asset.

The Technical Battleground: Why $68,000 is the "Moment of Truth"
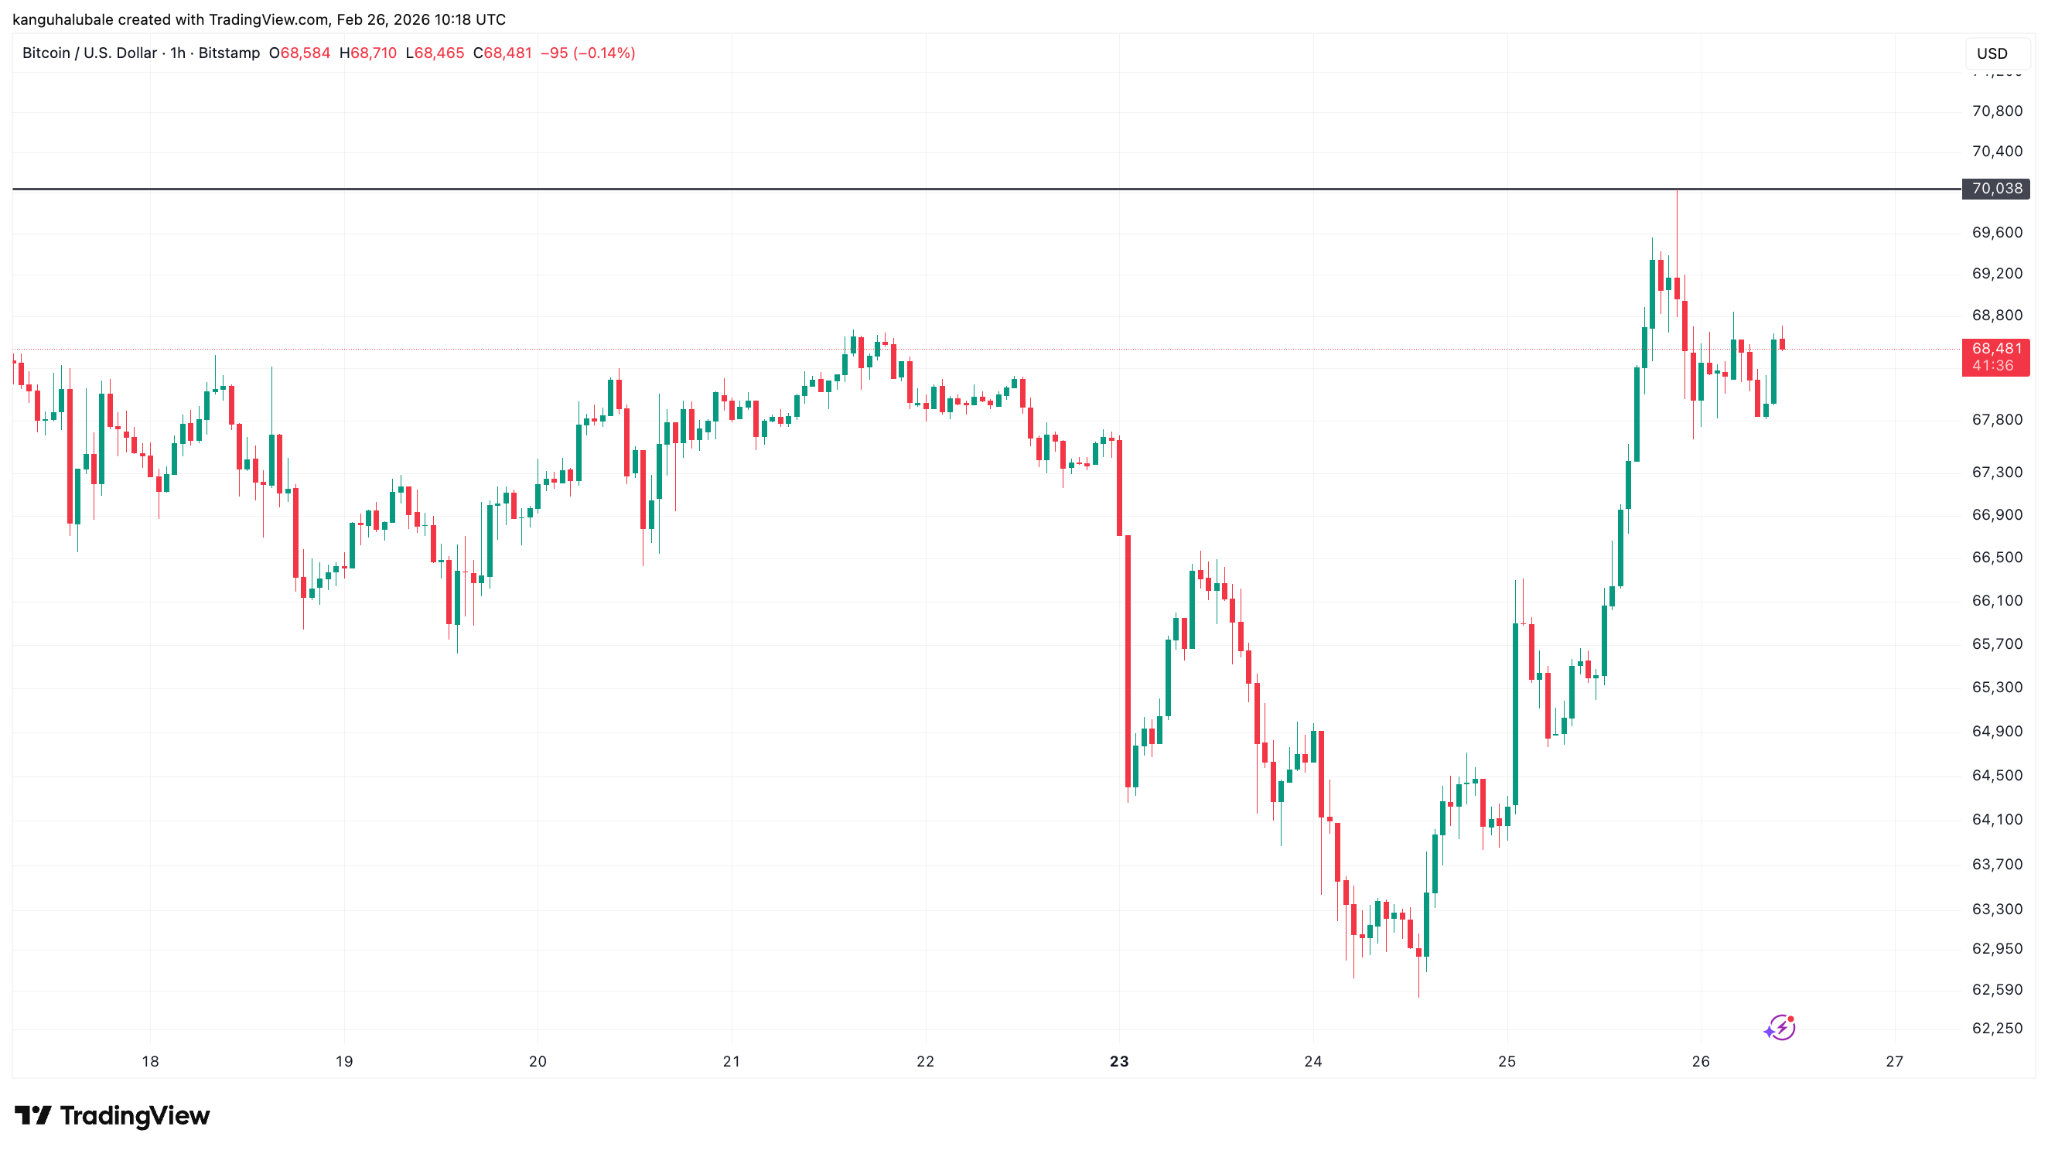
Market data from TradingView highlights the precision with which Bitcoin is interacting with its long-term moving averages. During the peak of the Wednesday session, the BTC/USD pair reached $70,000 before experiencing a minor retracement to the $68,480 range. This price level is strategically significant as it sits just above the 200-week exponential moving average (EMA), which currently resides at $68,338.
Technical analysts, including the widely followed researcher Rekt Capital, have identified this trendline as the defining boundary for Bitcoin’s next macro move. According to historical price action, Bitcoin often faces stiff resistance at the 200-week EMA following a period of downward pressure. The current recovery is being scrutinized as a potential "post-breakdown retest," where the EMA, once acting as support, is tested as a new resistance level. Rekt Capital noted that Bitcoin is currently facing its "moment of truth," emphasizing that a weekly close above this EMA—and subsequently flipping it back into a support floor—would be a move that "goes against the grain of history," signaling extraordinary underlying strength in the current market cycle.
On shorter timeframes, the technical picture remains equally complex. Jelle, another prominent market analyst, pointed to the four-hour chart as a key indicator of short-term health. Specifically, the 50 EMA on the four-hour timeframe, situated at approximately $68,000, must be secured as support to confirm that the recent recovery is not a "dead cat bounce." Furthermore, if bulls can successfully break and hold the 20-day EMA at $69,220, the path clears for a rally toward $74,508, the zone where the previous all-time high sellers are expected to reappear.

The Liquidity Landscape: A Path to $80,000 via Short Squeezes
While technical indicators provide the roadmap, liquidity clusters provide the fuel for price movement. Data from the monitoring resource CoinGlass reveals a massive concentration of ask-orders—sell limit orders—stacked between $72,450 and $75,000. Estimates suggest that nearly $2 billion in short positions and sell orders are clustered in this narrow range.
In the world of cryptocurrency trading, these clusters act as magnets for price. Large players often drive the price into these "liquidity pockets" to fill their own large buy orders or to trigger "stop-loss" orders from short sellers. If Bitcoin manages to break through the $75,000 resistance, it is widely expected to trigger a "liquidation squeeze." In such a scenario, short sellers are forced to buy back Bitcoin to close their losing positions, creating a feedback loop of buying pressure that can result in rapid, vertical price appreciation.
Analyst AlphaBTC commented on this phenomenon, stating that the current "liquidity hunt" has only just begun. According to this view, unless a significant negative macroeconomic catalyst emerges, the market is likely to "run" these higher levels within the next few weeks. The next major liquidity cluster beyond $75,000 is situated near $80,000, a psychological and technical level that would represent a new price discovery phase for Bitcoin.

Institutional Resurgence: Record ETF Inflows Drive Market Sentiment
The recent price appreciation is not occurring in a vacuum; it is backed by a resurgence in institutional demand. Data from Farside Investors indicates that U.S.-based spot Bitcoin ETFs recorded two consecutive days of massive inflows, totaling $765 million. Wednesday alone saw $507 million flow into these products, marking the highest single-day inflow since early February.
This influx of capital suggests a shift in market dynamics. While retail interest often drives speculative "FOMO" (fear of missing out) rallies, the current move is characterized by "institutional accumulation." Analysts observing these flows, such as the X user Raster, noted that the combination of ETF inflows and technical breakouts indicates a more structured and sustainable form of demand. This institutional support provides a "bid" under the market, making it more difficult for prices to sustain deep corrections.
The Wednesday inflow of $507 million is particularly noteworthy as it reflects a broad appetite across various funds, including BlackRock’s IBIT and Fidelity’s FBTC. This level of buying power effectively removes thousands of BTC from the circulating supply daily, placing it into long-term institutional custody. When this supply-side constraint meets the aforementioned liquidity squeeze on the sell side, the resulting "supply shock" is often the primary driver of parabolic price increases.

Chronology of the Weekly Rally
To understand the current positioning, it is essential to look at the sequence of events leading to the $70,000 touchpoint:
- Monday Consolidation: Bitcoin began the week under pressure, hovering near the $66,000 mark as traders awaited cues from the traditional financial markets and upcoming earnings reports.
- Tuesday Pivot: Following a rebound in the U.S. stock market and strong earnings data from the tech sector, risk appetite returned to the crypto markets. Bitcoin reclaimed $68,000, supported by an initial $258 million in ETF inflows.
- Wednesday Breakout: During the New York session, Bitcoin aggressively targeted sell liquidity, briefly tapping $70,000. This move was synchronized with the massive $507 million ETF inflow, the largest in months.
- Current Stabilization: As of Thursday, the market is attempting to establish a base above the 200-week EMA ($68,338), with traders closely watching the weekly candle close to determine the bias for the following week.
Broader Economic Context and Market Implications
The strength of Bitcoin is also being viewed through the lens of broader macroeconomic conditions. A recent rebound in the global stock market, fueled by strong corporate earnings and a cooling of certain inflationary pressures, has boosted the general appetite for risk assets. Bitcoin, often viewed as a "high-beta" version of the Nasdaq, has benefited from this shift in sentiment.
Furthermore, the "growing adoption" narrative continues to gain traction. On-chain data suggests that "whales"—entities holding 1,000 BTC or more—have been in a phase of steady accumulation throughout the recent price fluctuations. This suggests that large-scale holders are not looking to exit at $70,000, but are instead positioning for significantly higher valuations.

The implications of a successful break above $70,000 and the subsequent hunt for $80,000 liquidity are profound. It would signal the end of the post-halving "re-accumulation" phase and the beginning of the "parabolic" phase of the current market cycle. However, market participants remain cautious; a failure to close the week above $68,000 could result in a "rejection" scenario, where Bitcoin returns to test lower support levels near $64,000 or $60,000 to shake out late-stage long positions.
As the week draws to a close, the focus remains squarely on the $68,000 to $70,000 corridor. With billions of dollars in liquidations hanging in the balance and institutional checkbooks wide open, the "moment of truth" for Bitcoin is no longer a distant prospect, but an immediate reality. Whether the "liquidity hunt" culminates in an $80,000 price tag or a historical rejection at the 200-week EMA will likely be decided by the end of the Sunday trading session.