The statistical reality of Bitcoin (BTC) as an investment asset suggests that time in the market is significantly more critical than timing the market, according to a comprehensive historical analysis released by André Dragosch, the head of research at Bitwise Europe. By reviewing Bitcoin’s price performance data spanning from July 17, 2010, to February 11, 2026, Bitwise has quantified the correlation between holding duration and the probability of investment loss, concluding that the risk of capital erosion diminishes toward zero as the investment horizon extends beyond a decade.
The study provides a rigorous mathematical foundation for the "HODL" philosophy—a term popularized in the cryptocurrency community to describe long-term holding—demonstrating that the volatility for which Bitcoin is famous tends to be neutralized over multi-year cycles. According to the data, the probability of an investor being "in the red" (holding an asset worth less than its purchase price) drops to a negligible 0.70% once the holding period reaches a minimum of three years. This finding suggests that nearly every rolling three-year entry point in the history of the digital asset has resulted in a profitable outcome for the investor.
The Statistical Breakdown of Holding Periods and Risk
The Bitwise analysis categorizes the risk of loss across several timeframes, illustrating a clear inverse relationship between the length of ownership and the likelihood of financial deficit. For short-term market participants, the risk remains remarkably high, reflecting Bitcoin’s inherent price swings and sensitivity to macroeconomic shifts.

For instance, intraday traders—those who buy and sell within a 24-hour window—faced a 47.1% chance of their position being underwater at the close of the day. This high failure rate persists across other short-term windows: investors holding for one week faced a 44.7% probability of loss, while those with a one-month horizon saw a 43.2% risk. Even at the one-year mark, the probability of holding a losing position remained significant at 24.3%.
However, the data shifts dramatically as the timeframe moves into the multi-year range. Beyond the three-year mark, where the risk sits at 0.70%, the probability of loss continues to evaporate. At a five-year holding period, the risk falls to a mere 0.2%. Most notably, the research concludes that for any investor who held Bitcoin for a ten-year duration at any point in its history, the probability of loss was 0%. This historical 100% success rate for decade-long holders reinforces Bitcoin’s emerging status as a long-term store of value rather than a purely speculative vehicle.
Realized Price and the "Strong Hands" Profit Margin
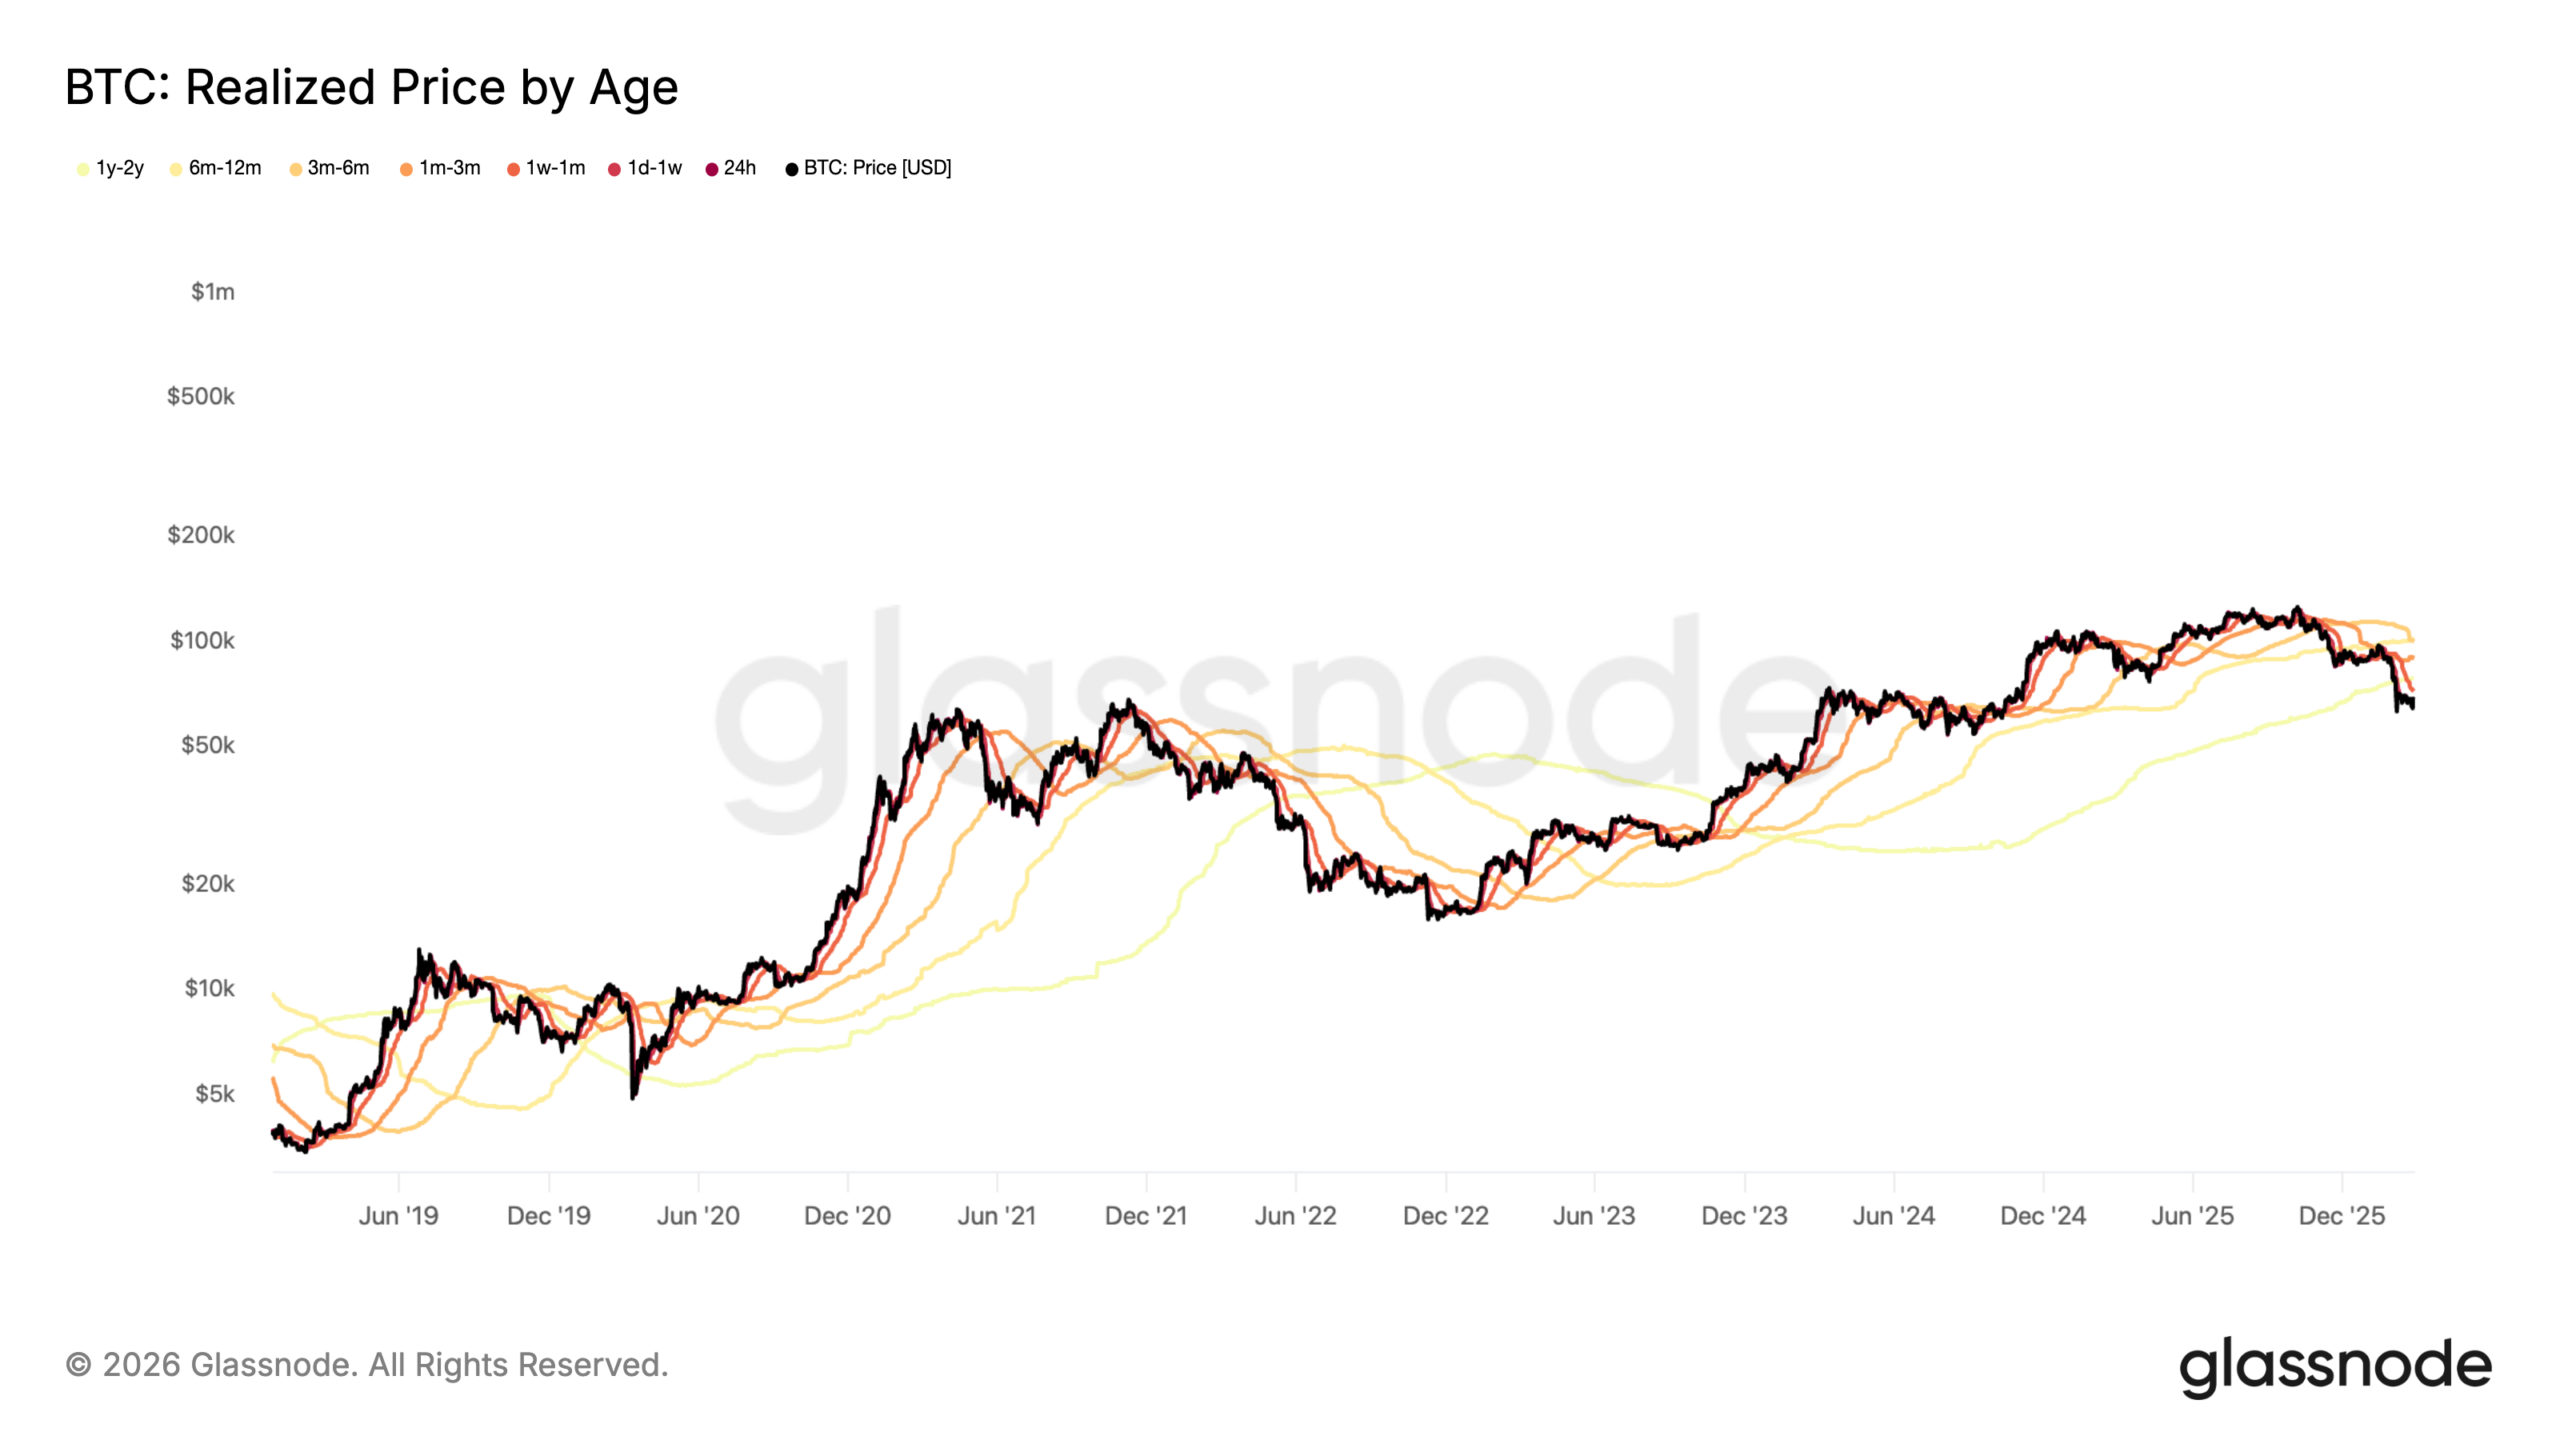
A critical metric in understanding investor health is the "realized price," which represents the average price at which all Bitcoin currently in circulation was last moved—essentially the aggregate cost basis of the market. As of early February 2026, the market finds itself in a period of significant correction, with Bitcoin trading at approximately $65,000, a 50% decline from its all-time high of roughly $130,000 reached in October 2025.
Despite this massive drawdown, long-term holders remain in a position of strength. The realized price for the cohort of investors who have held Bitcoin for three to five years is currently $34,780. This means that even after a 50% market-wide price collapse, these "strong hand" investors are still maintaining an unrealized profit of approximately 90%.

In stark contrast, more recent market entrants are bearing the brunt of the current correction. The Bitwise and Glassnode data reveal that the 6-month to 12-month cohort—entities that purchased Bitcoin during the height of the 2025 bull run—has an average cost basis of $101,250. With the current price at $65,000, these investors are facing an unrealized loss of roughly 35%. Similarly, the 1-year to 2-year cohort holds a cost basis of $78,150, resulting in a 15% unrealized loss. This discrepancy highlights a recurring pattern in digital asset markets: corrections tend to flush out "new money" while the "old money" cushions the market floor.
Chronology of the 2025-2026 Market Cycle
To understand the current data, it is necessary to examine the timeline of events leading to the present market state. The 2024 Bitcoin halving event set the stage for a massive supply-side squeeze, which, combined with the maturation of spot Bitcoin Exchange-Traded Funds (ETFs) in the United States and Europe, propelled the price to unprecedented heights.
- April 2024: The fourth Bitcoin halving occurs, reducing the block reward and tightening new supply.
- Early 2025: Institutional adoption accelerates, with corporate treasuries and pension funds increasing their allocations to digital assets.
- October 2025: Bitcoin reaches a peak of approximately $130,000, driven by a "perfect storm" of low supply and high retail FOMO (fear of missing out).
- November 2025 – January 2026: A series of macroeconomic headwinds, including persistent inflation and a "crisis of confidence" in the technology sector, triggers a broad sell-off.
- February 2026: Bitcoin stabilizes around the $65,000 mark, leading to the current Bitwise analysis of holder profitability.
The ongoing correction has sparked a debate among analysts regarding where the ultimate price floor resides. Some technical traders argue that the correction could extend toward the $30,000 level. Such a move would be historically significant, as it would push the three-to-five-year realized price band toward a breakeven point. This would represent a critical psychological test for long-term holders; if this group begins to capitulate, the market could face a deeper liquidity crisis. However, historical data suggests that this cohort typically views such drawdowns as accumulation opportunities rather than exit signals.
Institutional Reactions and Future Price Forecasts
Despite the current 50% drawdown, major financial institutions maintain a largely bullish outlook for the 2026–2027 period. The consensus among institutional analysts is that the current price action represents a healthy deleveraging process rather than a fundamental failure of the asset class.

Bernstein, a leading global brokerage firm, has maintained its $150,000 price target for Bitcoin for the end of 2026. Analysts led by Gautam Chhugani noted that while the price has halved, net outflows from spot Bitcoin ETFs have been relatively modest, totaling only about 7%. "The current Bitcoin price action is a mere crisis of confidence," Bernstein stated, suggesting that the structural integrity of the market remains intact despite the volatility.
Standard Chartered has offered a more cautious short-term outlook while remaining optimistic for the long term. The bank warned of a potential "final capitulation" phase that could see Bitcoin drag toward $50,000, citing weak ETF flows and a difficult macroeconomic backdrop. However, they anticipate a robust recovery, forecasting a return to $100,000 by the end of 2026 as global liquidity conditions improve.
Looking further ahead into 2027, quantitative models are providing even more aggressive targets. Analyst Timothy Peterson has utilized an "average return" framework based on historical trailing positive months and put option payoff data. This model points to a target of $122,000 by early 2027, suggesting that the current period of stagnation is likely a temporary detour in a broader upward trajectory.
Broader Implications and Market Analysis
The Bitwise data carries significant implications for both retail and institutional portfolio management. First, it challenges the narrative that Bitcoin is too volatile for traditional retirement accounts or long-term savings. If the probability of loss over a ten-year period is indeed 0%, Bitcoin begins to behave less like a speculative tech stock and more like a high-beta version of gold.

Second, the data emphasizes the danger of "leverage-induced" volatility. The high probability of loss for intraday and weekly holders is often exacerbated by high-leverage trading, where small price movements can trigger liquidations. By shifting the focus to multi-year horizons, investors can bypass the "noise" of liquidations and focus on the "signal" of network adoption and scarcity.
Finally, the gap between the realized price of long-term holders ($34,780) and short-term holders ($101,250) serves as a stark reminder of the "cost of waiting." Those who entered the market during the euphoria of 2025 are currently paying a premium for their entry, whereas those who bought during previous periods of stagnation or "boring" price action are the ones currently insulated from the crash.
Conclusion
The findings from Bitwise Europe suggest that Bitcoin rewards patience above all other virtues. While the asset remains prone to violent 50% drawdowns—as evidenced by the retreat from $130,000 to $65,000—these movements appear as mere blips when viewed through the lens of a three, five, or ten-year investment cycle. As the market matures and institutional frameworks like ETFs provide more stable entry points, the "time-to-profitability" metrics may continue to stabilize. For now, the data remains clear: the longer an investor is willing to hold, the more the mathematical odds of success shift in their favor.