James Watt
The digital asset market witnessed a notable shift in momentum over the weekend as Bitcoin and Ethereum orchestrated a recovery following a period of intense selling pressure. Bitcoin, the world’s largest cryptocurrency by market capitalization, successfully reclaimed the $84,000 threshold after a volatile week that saw prices dip toward the $80,000 mark. Simultaneously, Ethereum, the leading smart-contract platform, managed to climb back above the $2,500 level, providing a reprieve for investors who had weathered recent double-digit drawdowns. Despite these gains, a closer examination of on-chain data and derivatives market positioning suggests that the current rebound may be approaching a significant technical ceiling. Market analysts point to a dense concentration of investor acquisition costs and a cooling of bullish sentiment among large-scale derivatives traders as primary obstacles that could stall further upward movement in the immediate term.
Chronology of the Recent Market Volatility
The path to the current recovery began during a turbulent week of trading characterized by a significant "liquidation bloodbath." In the days leading up to the weekend, the cryptocurrency market faced a cascade of sell-offs that saw Bitcoin crash through an $81,000 "buy wall," eventually bottoming out near $80,000. This downward move was exacerbated by the liquidation of over $1 billion in leveraged positions across the broader crypto ecosystem. The sell-off was partially attributed to macroeconomic uncertainty and a shift in investor sentiment following disappointing payroll data, which led to questions regarding the sustainability of institutional demand through U.S.-based spot Exchange-Traded Funds (ETFs).
By Friday, October 11, the market began to stabilize. Analysts observed the formation of a liquidity cluster just above the prevailing market price, which acted as a magnet for short-term traders. Throughout Saturday and into Sunday’s trading sessions, Bitcoin gained momentum as buyers capitalized on this liquidity. This shift was supported by the establishment of a substantial wall of buy orders beneath the market, providing a floor that allowed Bitcoin to advance toward the $84,000 level. However, as the new week approaches, the focus has shifted from the successful defense of the $80,000 support to the formidable resistance waiting in the mid-$80,000 range.
Bitcoin’s $85,000 Resistance: The Acquisition Cost Barrier
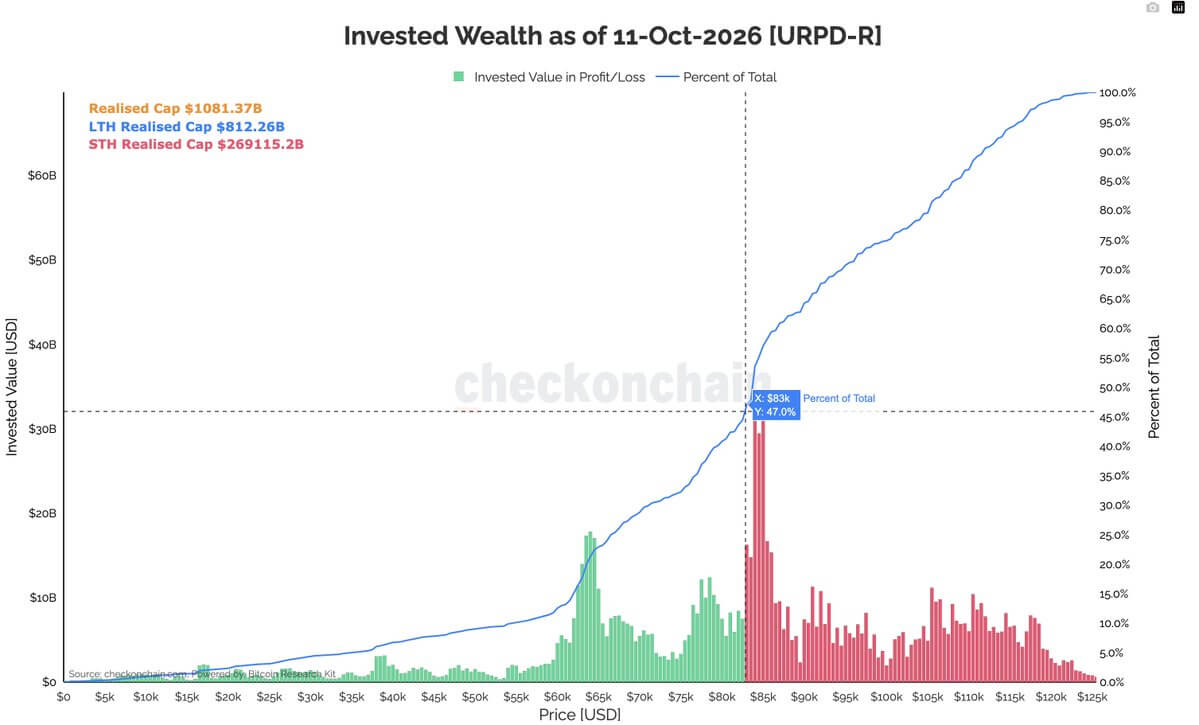
As Bitcoin approaches the $84,000 to $85,000 range, it enters a zone of high historical friction. On-chain data provided by Checkonchain and highlighted by market analysts indicates that a significant portion of Bitcoin’s currently invested capital is held by investors who entered the market at prices higher than the current spot value. Specifically, approximately 53% of Bitcoin’s invested wealth has an estimated acquisition price above $83,000.
The most critical concentration of these acquisition costs sits between $84,000 and $85,000. In market psychology, these levels often function as "breakeven" points. Investors who purchased Bitcoin during previous peaks and subsequently sat through drawdowns often seek to exit their positions when the price returns to their initial entry point. This phenomenon creates a natural surge in selling pressure—often referred to as "overhead supply"—that buyers must absorb to sustain a rally.

CryptoQuant analyst J.A. Maartunn noted that while the spot Bid/Ask Ratio—a metric measuring buying versus selling liquidity within 1% of the market price—rose to 0.3, indicating strengthened buying interest, this liquidity remains fragile. If the price fails to break through the $85,000 barrier decisively, these buy orders may be canceled, leaving the price vulnerable to a reversal. Analyst Darkfost has identified the $77,000 to $79,000 range as the primary support zone should Bitcoin fail to clear the current resistance.
Ethereum’s Recovery and the Risks of Leveraged Positioning
While Ethereum’s move back above $2,500 has provided some relief, the underlying structure of its recovery appears more precarious than Bitcoin’s. The primary concern for Ethereum lies in the derivatives market, where the behavior of "whales"—large-scale institutional or private investors—suggests a lack of conviction in the current uptrend.
Joao Wedson, CEO of Alphractal, recently highlighted that Ethereum’s 30-day and 180-day open-interest deltas have turned negative. Open interest refers to the total number of outstanding derivative contracts, such as futures and options, that have not been settled. A negative delta indicates that more positions are being closed than opened, signaling a contraction in market participation. More tellingly, the "Whale vs. Retail Delta" indicator has shown weakening readings, suggesting that while retail investors might be buying the dip, larger market participants are either reducing their bullish exposure or actively opening defensive short positions.
Despite the recent reduction in open interest, the total volume of outstanding Ethereum futures remains substantial, sitting at approximately 10.58 million ETH. At a valuation of $2,500 per ETH, this represents a staggering $26.5 billion in notional exposure. This high level of leverage creates a "tinderbox" scenario; if Ethereum’s price faces a sudden rejection at higher levels, a wave of forced liquidations for long positions could trigger a rapid downward spiral, undoing the weekend’s progress.
Institutional Sentiment and ETF Dynamics
The broader context of this recovery is inextricably linked to the performance of U.S. spot ETFs. Earlier in the month, Ethereum spot ETFs recorded significant outflows, totaling over $200 million in a single reporting period. This exodus of institutional capital has weighed heavily on Ethereum’s price action, often causing it to lag behind Bitcoin during market-wide recoveries.
For Bitcoin, the recovery is a test of whether the "ETF class" of investors—those who have entered the market through traditional brokerage accounts since the January 2024 approvals—remains committed. The recent price action suggests that while the initial panic of the $80,000 touch has subsided, institutional buyers are not yet aggressively chasing the price into the $85,000 resistance zone. The market is currently in a "wait-and-see" mode, looking for confirmation that the macroeconomic environment, particularly U.S. Federal Reserve policy and employment data, will support a continued risk-on environment.
Technical Analysis of Order Book Depth
A key factor in the weekend’s price stability was the evolution of order book depth. The Bid/Ask Ratio’s climb to 0.3 reflected a tactical shift by market makers and swing traders. By placing large buy orders just below the market price, these participants created a psychological and technical buffer. This "buy wall" forced sellers to exhaust their supply before the price could move lower, eventually allowing the lack of immediate selling pressure to translate into a price increase.
However, order book liquidity is notoriously "flighty." Unlike long-term on-chain holdings, order book depth can vanish in seconds if volatility spikes. The concentration of liquidity above the current price acted as a target for the weekend rally, but now that Bitcoin has reached these levels, the absence of a new, higher liquidity cluster suggests that the upward momentum may be losing steam.
Broader Market Implications and Future Outlook
The current state of the cryptocurrency market can be described as a fragile equilibrium. On one hand, the successful defense of the $80,000 level for Bitcoin and $2,400 for Ethereum demonstrates that there is still significant "buy-the-dip" appetite among both retail and institutional cohorts. On the other hand, the heavy concentration of underwater positions near $85,000 acts as a formidable gatekeeper.
If Bitcoin can achieve a daily close above $85,000 with high trading volume, it would signal that the market has successfully absorbed the overhead supply. Such a move would likely flip the $85,000 level from resistance to support, clearing the path for an attempt at new all-time highs. Conversely, a failure to break this level in the coming days could lead to a period of consolidation or a "retest" of the $77,000 support range to flush out remaining weak-handed leveraged traders.
For Ethereum, the path forward is even more dependent on the derivatives market. A sustained recovery will require "whales" to return to the long side of the market. Until the open-interest deltas turn positive and the Whale vs. Retail Delta stabilizes, Ethereum remains vulnerable to "long squeezes," where small price drops trigger massive liquidations, leading to disproportionate price crashes.
In conclusion, while the weekend recovery has provided a much-needed boost to market morale, the technical and on-chain hurdles ahead are substantial. Investors and traders are advised to monitor the $85,000 level for Bitcoin and the derivatives liquidation data for Ethereum, as these will be the primary determinants of whether this rally is the start of a new leg up or merely a "dead cat bounce" in a larger corrective phase. Professional market participants remain cautious, balancing the optimism of the rebound against the hard data of investor cost bases and leveraged risks.