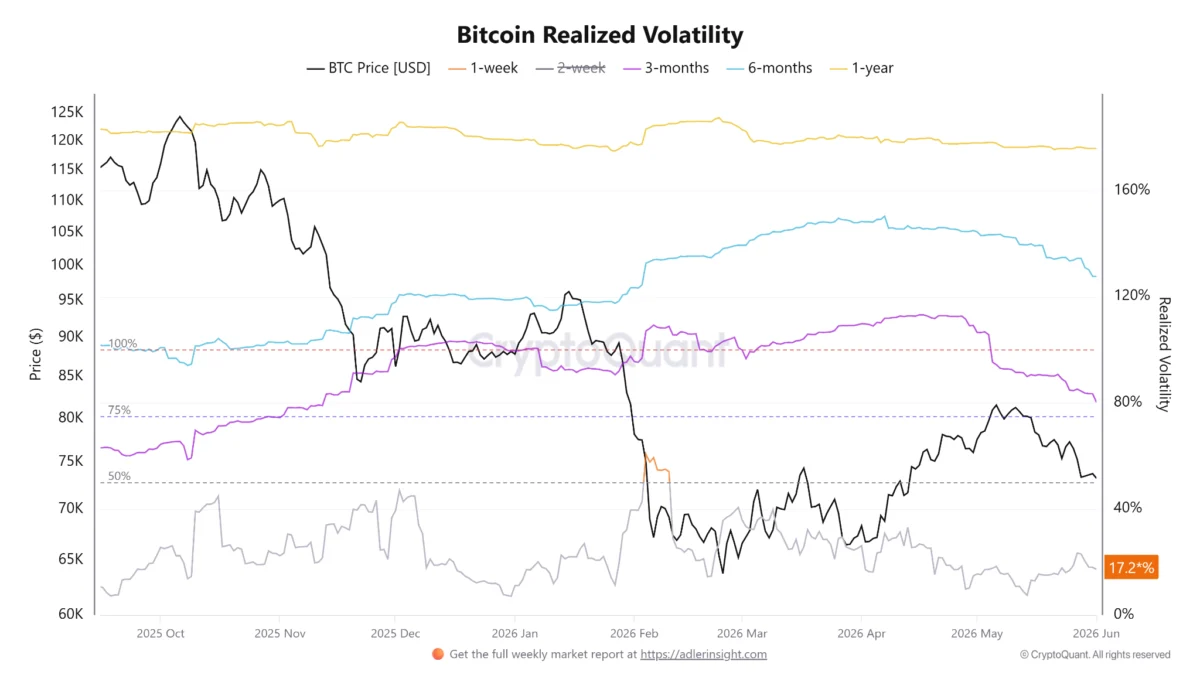
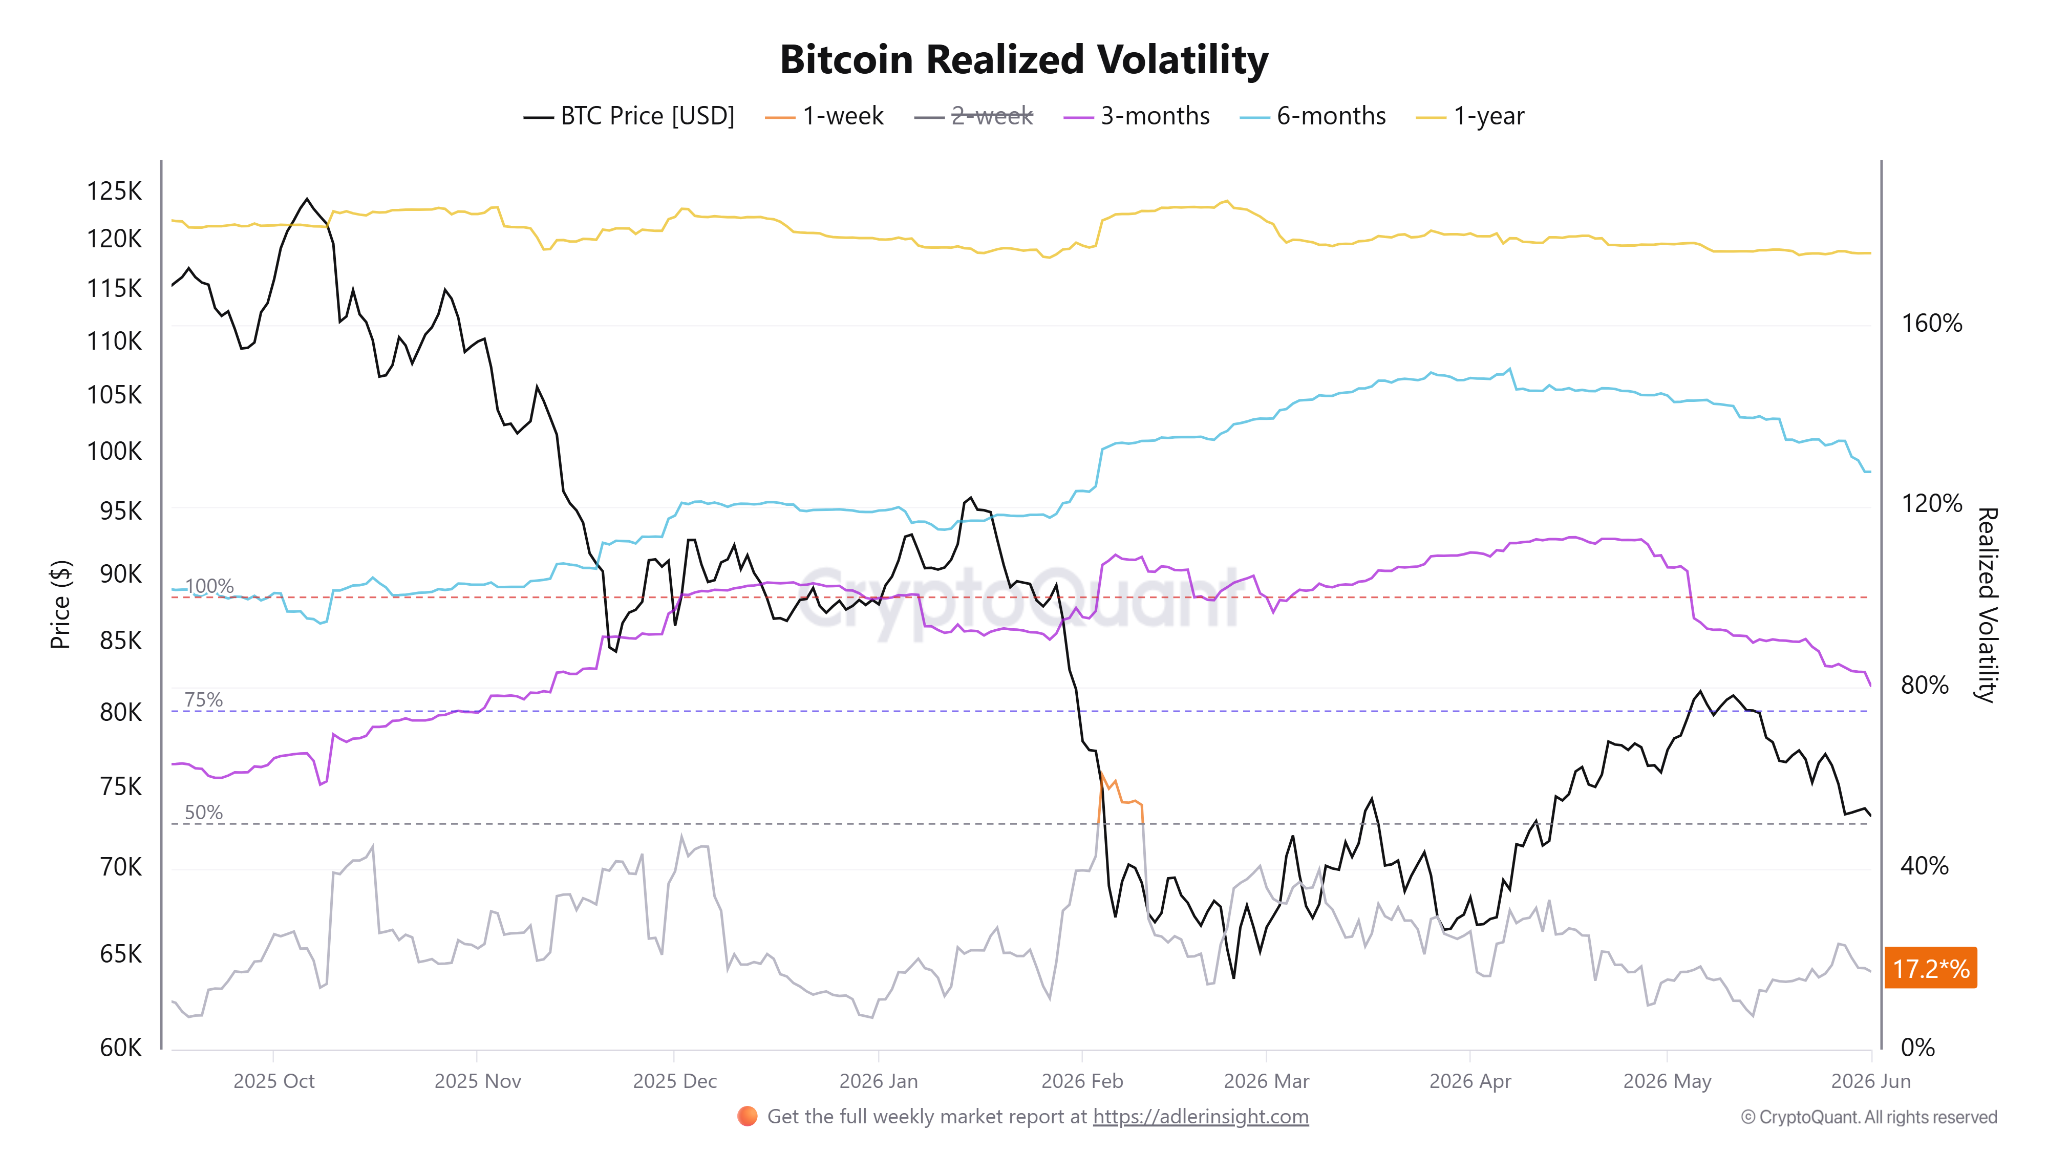
The digital asset market is currently witnessing a significant technical phenomenon as Bitcoin’s realized volatility has plummeted to 17.2%, marking one of its lowest points in several months. This contraction in price turbulence has historically served as a precursor to substantial market movements, leading several prominent analysts to suggest that the cryptocurrency is entering a "coiled spring" phase. According to recent data, this decline in volatility is not an isolated incident but part of a broader trend observed throughout the second quarter of 2024, where price action has become increasingly compressed within a well-defined trading range.
Realized volatility, a metric that calculates the standard deviation of returns over a specific historical period, provides a clear picture of how much an asset’s price has actually fluctuated. At its current level of 17.2%, Bitcoin is trading significantly below its long-term median volatility of approximately 40%. This suggests that the market has transitioned from the high-energy, speculative fervor seen earlier in the year to a state of cautious consolidation. While low volatility is often perceived by retail investors as a lack of interest, institutional observers frequently view it as a period of "re-accumulation" where momentum builds behind the scenes before a decisive trend emerges.
Detailed Breakdown of Volatility Compression in Q2
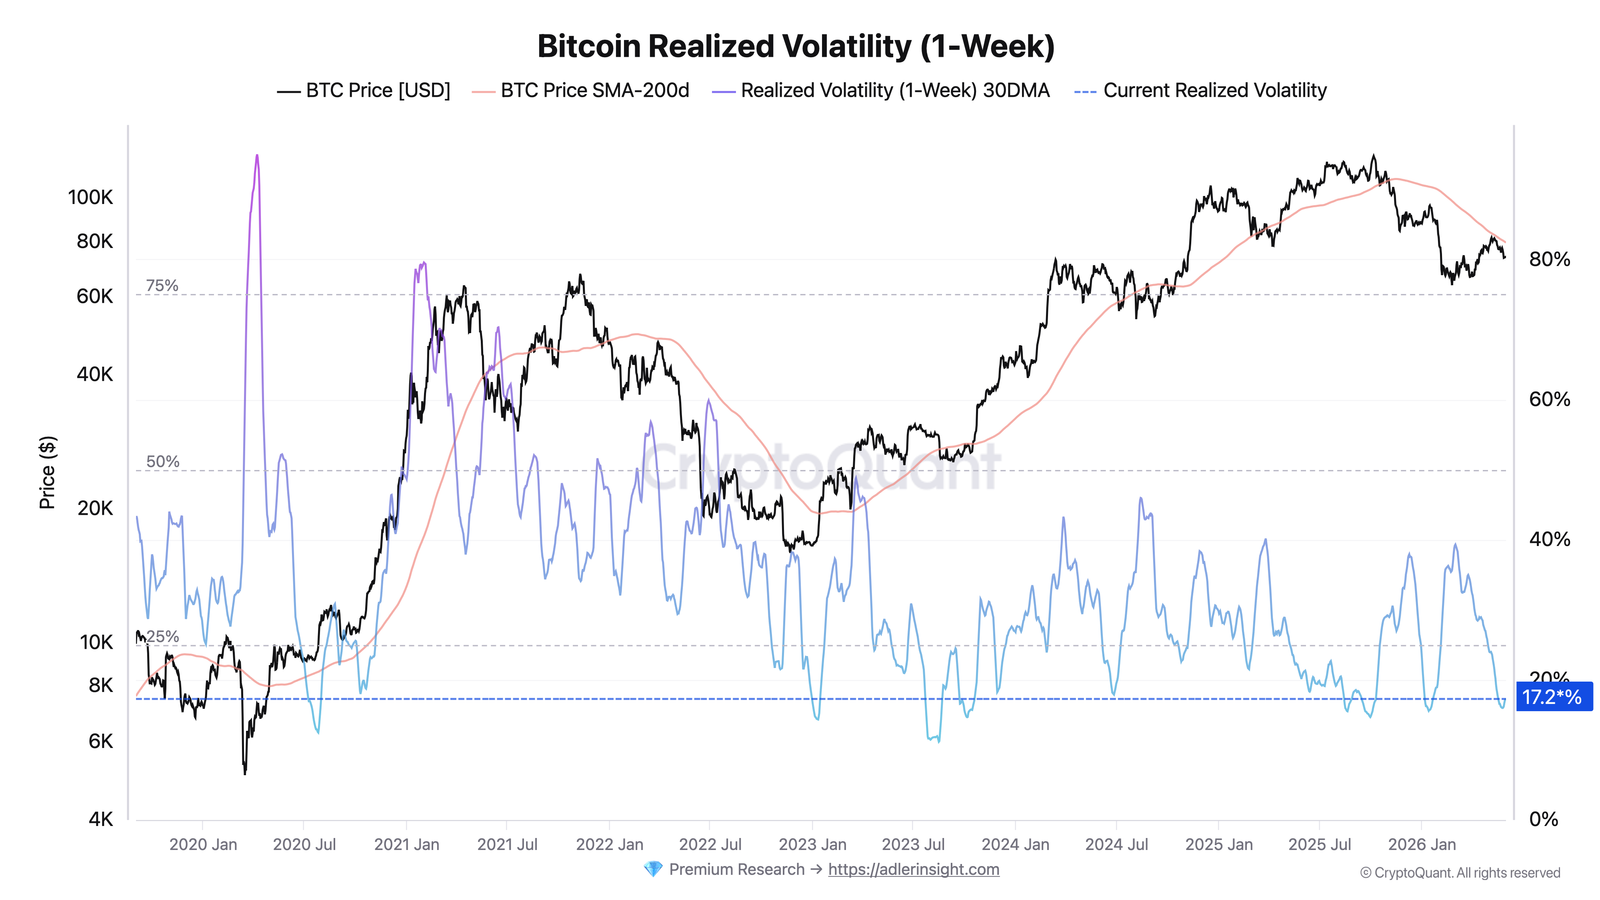
The decline in Bitcoin’s price swings has been particularly sharp over the last three months. Axel Adler Jr., a noted Bitcoin researcher, highlighted that the one-week realized volatility, when smoothed over a 30-day moving average, has collapsed from 39% at the beginning of the quarter to the current 17.2%. This represents a 56% reduction in volatility within a single quarter. This "smoothing" of the data helps to filter out daily "noise" and provides a more accurate representation of the underlying market temperament.

The cooling trend is further evidenced when examining longer timeframes. Data from CryptoQuant indicates that three-month realized volatility has receded from 109% in early April to 80% by mid-June. Similarly, six-month realized volatility has dipped from 148% to 127%. The synchronization of these declines across multiple timeframes suggests a systemic stabilization of the Bitcoin market. Historically, when multi-timeframe volatility measures align at low levels, the subsequent "breakout" tends to be more forceful, as the market seeks to correct the period of inactivity with a high-momentum move.
However, it is essential to note that volatility metrics are directionally agnostic. While they indicate that a major move is likely, they do not inherently predict whether the price will break to the upside or the downside. Instead, they serve as a gauge of "market tension." The current compression indicates that the "tug-of-war" between buyers and sellers is reaching a stalemate, a condition that usually ends when one side exhausts its liquidity, leading to a rapid price adjustment.
The Valuation Gap: Market Cap vs. Realized Cap
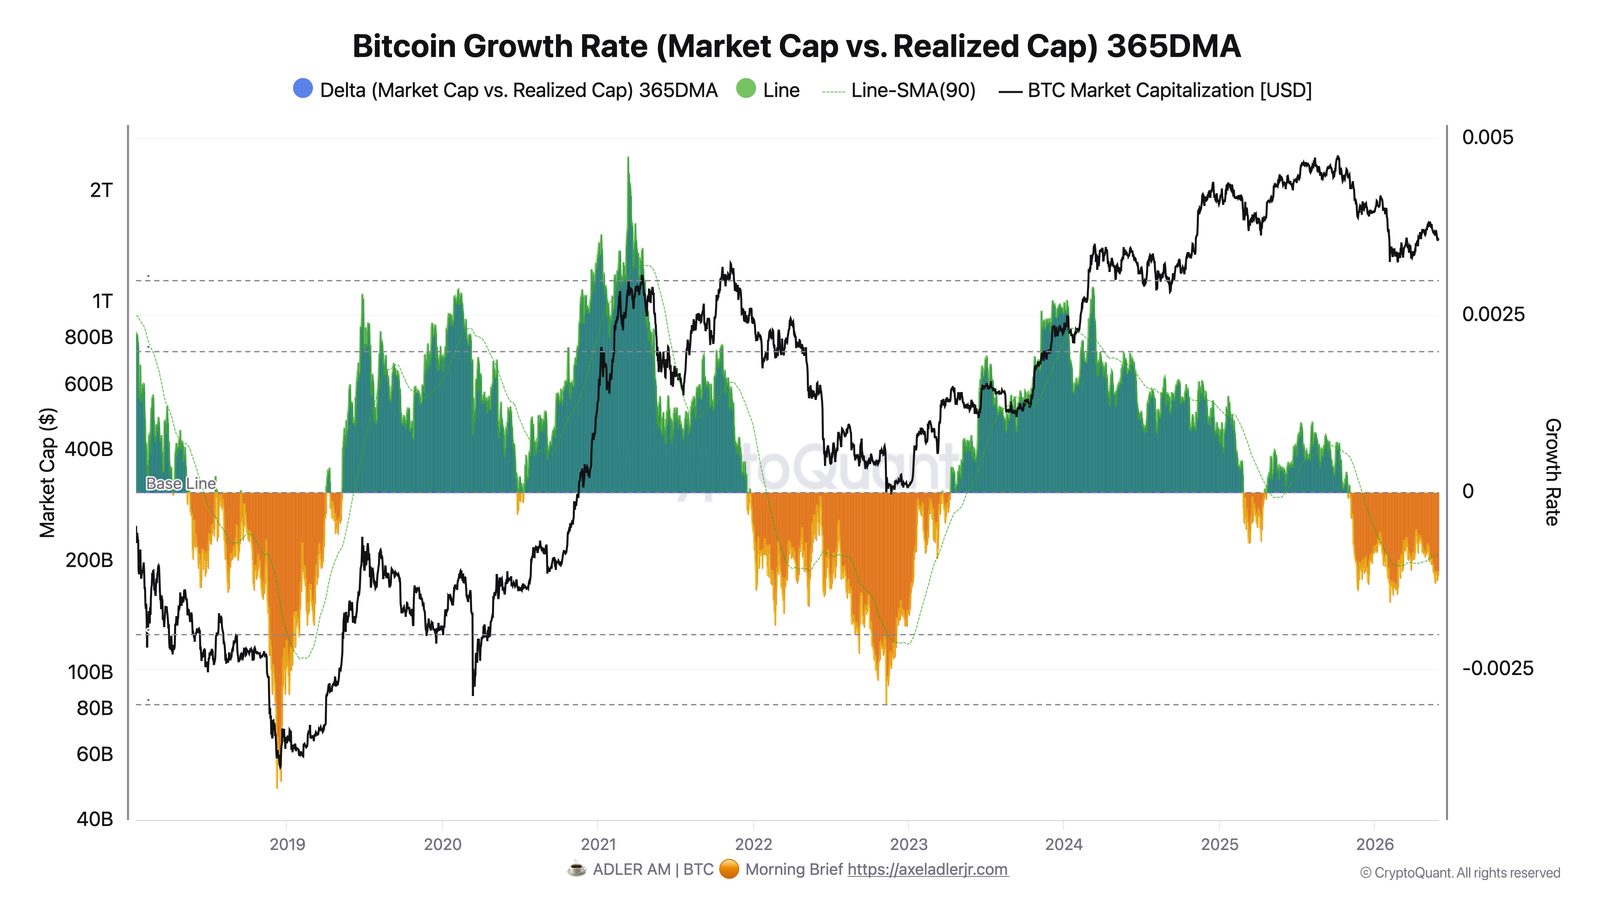
Beyond simple price action, the underlying valuation of the Bitcoin network is providing additional clues regarding the current market state. Analysts are paying close attention to the Bitcoin growth rate metric, which compares the growth of the total market capitalization to the realized capitalization. Realized capitalization is a more granular metric that values each Bitcoin at the price it was last moved on-chain, rather than the current market price. This provides a "cost-basis" view of the entire network.
For more than six months, the delta between market cap growth and realized cap growth has remained negative. Recently, the 365-day moving average of this delta slipped to -0.0013. This negative value indicates that Bitcoin’s market value is growing at a slower pace than the actual capital flowing into the network. In simpler terms, investors are putting money into the asset—raising its realized value—but the market price has not yet reflected this influx of capital.
Adler suggests that this data points to a "cooling" market where investors are exercising extreme caution. The fact that capital continues to flow into the network while the price remains stagnant suggests a period of "quiet absorption." In previous market cycles, such a divergence between capital inflow and price appreciation has often been resolved by a sudden upward "catch-up" rally, where the market price surges to align with the increased realized value of the network.
Chronology of the Current Consolidation Phase
To understand the significance of the current 17.2% volatility level, it is necessary to review the chronology of Bitcoin’s price action over the first half of 2024.
- January – March 2024: The market experienced high volatility following the approval of Spot Bitcoin ETFs in the United States. This period saw Bitcoin surge to new all-time highs, driven by massive institutional inflows and retail FOMO (fear of missing out).
- April 2024: The "Halving" event occurred, reducing the daily issuance of new BTC. Contrary to some expectations of an immediate price spike, the market entered a "sell the news" phase, with volatility beginning its initial descent from the 40% range.
- May 2024: Bitcoin entered a broad horizontal channel, trading predominantly between $60,000 and $72,000. During this month, realized volatility began to drop below its long-term medians.
- June 2024: The consolidation reached its peak. For 114 days, Bitcoin has remained within a $20,000 range ($60k-$80k). The Bitcoin volatility index reached multi-month lows near 0.90, and the realized volatility hit the current 17.2% mark.
This 114-day range is significant because the longer an asset spends in a consolidation phase, the more "support" and "resistance" levels are reinforced. According to CryptoQuant analyst Maartunn, similar periods of range-bound trading and volatility compression have historically resulted in 10% to 20% price moves once the range is finally breached.
Market Sentiment and Expert Projections
Despite the stagnant price action, many market participants maintain a bullish outlook, citing the strength of historical support zones. Michael van de Poppe, founder of MN Capital, identified the current price level as a "crucial support zone." He noted that if historical patterns repeat, the market could be on the verge of a two-week period of intense upward momentum. However, he also warned that the $61,000 level must hold to prevent a deeper correction that could test lower liquidity pools.
Adding to this analysis, Amr Taha of CryptoQuant pointed toward a "tug-of-war" occurring between different classes of investors. His data shows that Binance has seen a $5.6 billion increase in Bitcoin inflows since April. Interestingly, retail investors contributed $3.6 billion of this total, while whale wallets (those holding large amounts of BTC) contributed $2 billion.
While exchange inflows are traditionally viewed as a bearish signal (suggesting investors are preparing to sell), the data is offset by significant accumulation. On May 30 alone, wallets holding between 1,000 and 10,000 BTC accumulated a staggering 55,450 BTC. This marks the strongest whale accumulation activity since February. This creates a complex market dynamic: while retail investors may be depositing funds to exchanges—potentially creating selling pressure—large-scale "whales" are aggressively removing supply from the market.
Broader Implications and Economic Context
The current state of Bitcoin cannot be viewed in a vacuum. The broader macroeconomic environment has played a pivotal role in suppressing volatility. The Federal Reserve’s "higher for longer" stance on interest rates has led to a general "risk-off" sentiment in global markets. Investors are waiting for clearer signals regarding inflation and potential rate cuts before committing to aggressive positions in volatile assets like cryptocurrencies.
Furthermore, the introduction of Spot Bitcoin ETFs has fundamentally changed the market’s structure. These institutional products tend to dampen volatility as large funds engage in programmatic buying and hedging strategies rather than the emotional, high-leverage trading typical of retail-dominated markets. This "institutionalization" of Bitcoin may be leading to a "new normal" where realized volatility remains lower than in previous cycles, but price moves become more sustained and less prone to "flash crashes."
The implications of a 17.2% volatility floor are twofold. For traders, it represents a period of low opportunity cost, where the risk of a sudden move is high but the direction remains uncertain. For long-term holders, it represents a period of stability that validates Bitcoin’s maturing status as a financial asset. If the "coiled spring" theory holds true, the current quietude is merely the silence before a significant shift in market structure.
As the market approaches the end of the second quarter, all eyes remain on the $60,000 support and the $72,000 resistance. With volatility at historic lows and whale accumulation rising, the technical stage is set for a resolution to the 114-day "tug-of-war." Whether the move is a 20% surge to new highs or a test of lower support levels, the data suggests that the current period of price compression is nearing its inevitable conclusion.