James Watt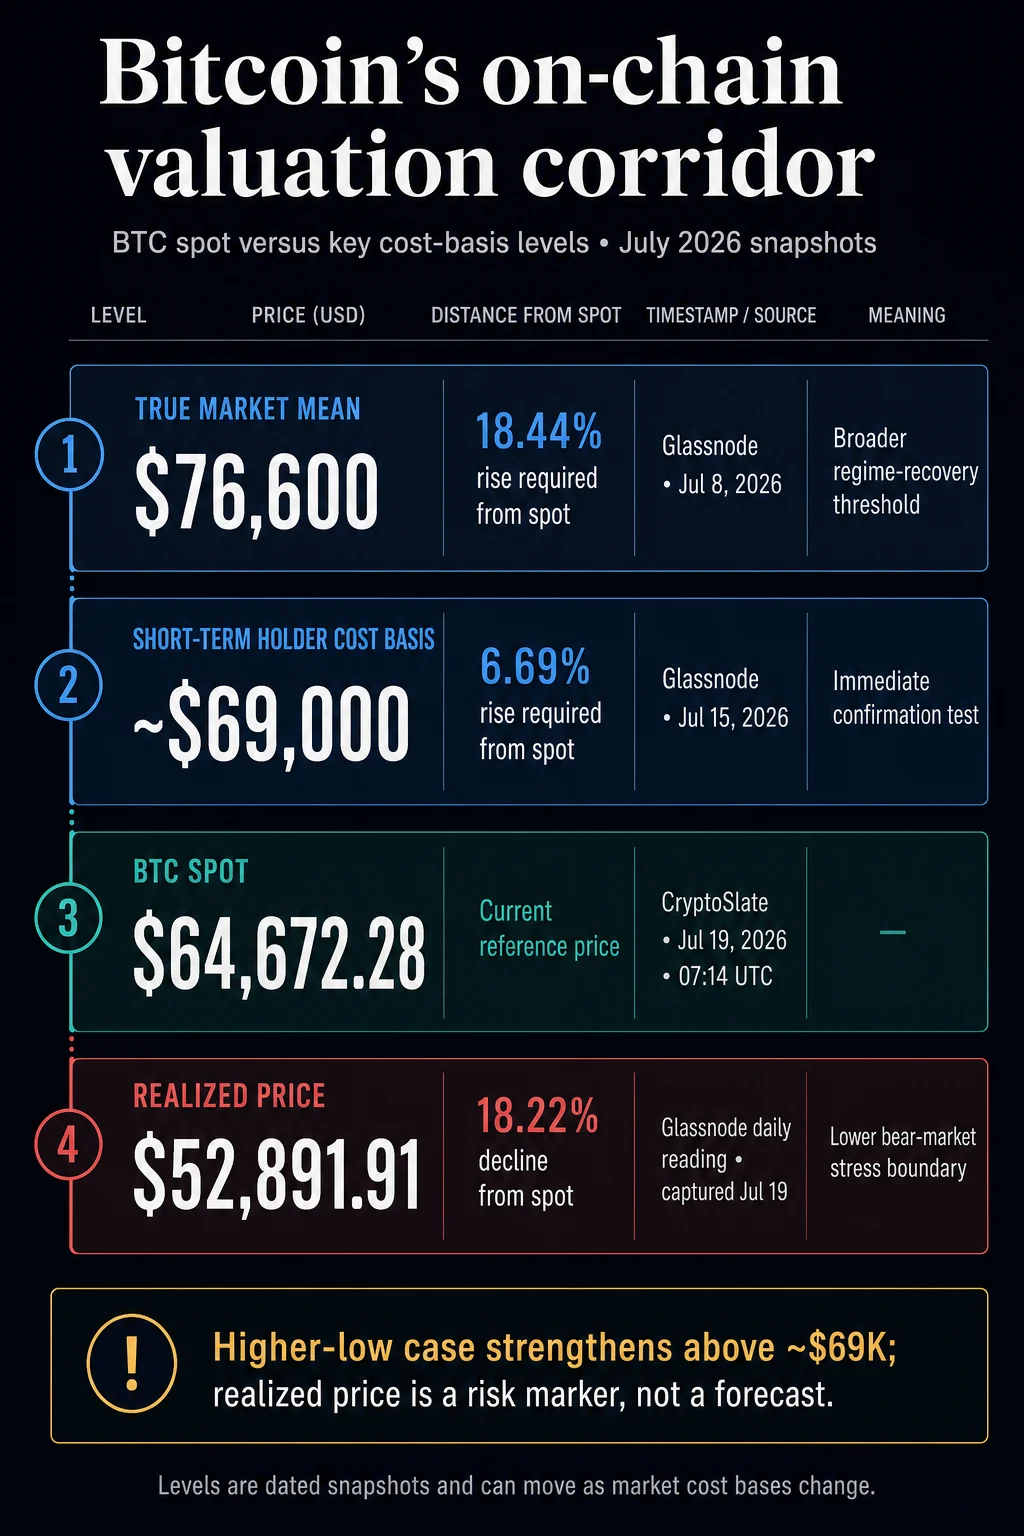
Bitcoin is currently navigating a pivotal technical and on-chain juncture, with its immediate recovery prospects tethered to the $69,000 level while its fundamental support floor remains significantly lower at approximately $52,900. As of July 19, market data indicates that Bitcoin (BTC) is trading at approximately $64,672, placing the digital asset in a precarious "no man’s land" between short-term bullish confirmation and long-term structural defense. To reclaim the cost basis of recent buyers at the $69,000 mark, Bitcoin requires a price appreciation of roughly 6.69%. Conversely, a retreat to the aggregate realized price of $52,891.91—a level often viewed as the ultimate bear-market boundary—would represent a correction of 18.22% from current spot prices.
This current price action defines a high-stakes, two-sided test for the market. A spot-driven reclaim of the short-term holder cost basis would provide the necessary evidence that Bitcoin has successfully established a "higher low," a classic technical signal of a trend reversal. However, continued stagnation or weakness below this threshold leaves the lower realized-price boundary exposed, particularly if macroeconomic shocks or localized selling pressure from large entities accelerate once again. While on-chain data suggests that the "bottoming" process has improved since the volatility witnessed in early July, the recovery remains unconfirmed, characterized by a cooling of long-term holder losses but a lack of aggressive, sustained buying conviction.
The On-Chain Corridor: Navigating the $69,000 to $52,900 Range
The current market structure is best understood through the lens of realized price and cost-basis metrics. Realized price is calculated by dividing the realized capitalization—the value of all coins at the price they last moved—by the total circulating supply. This metric serves as an estimate for the average price at which the entire market acquired its Bitcoin. When the spot price remains above this metric, the aggregate holder base sits in a state of unrealized profit. A dip below it signifies that the market, on average, is underwater, a condition that historically characterizes the deepest phases of bear markets.
According to analysis from Glassnode, the realized price functions as a natural structural boundary. It is not necessarily a "guaranteed floor" or a mandatory destination for every correction, but rather a level that marks extreme structural risk. The current corridor is defined by several moving thresholds that have shifted significantly over the first half of July.
Key Market Valuation Thresholds (As of July 19, 2024)
| Market Level | Verified Value & Timestamp | Distance from Spot & Market Signal |
|---|---|---|
| True Market Mean | $76,600 (July 8) | 18.44% above spot; marks the threshold for a broader regime recovery. |
| Short-Term Holder Cost Basis | ~$69,000 (July 15) | ~6.69% above spot; serves as the immediate test for recovery confirmation. |
| Bitcoin Spot Price | $64,672 (July 19) | Current reference point for market activity. |
| Realized Price | $52,891 (July 19) | 18.22% below spot; defines the lower bear-market stress boundary. |
These metrics are dynamic, shifting as coins change hands and ownership transfers between different cohorts of investors. For instance, in early July, the Short-Term Holder (STH) Cost Basis was positioned higher, near $72,200. As Bitcoin traded below this level for several weeks, the cost basis drifted downward to the current $69,000 level. This downward drift reflects the "capitulation" of recent buyers who sold at a loss, as well as new buyers entering at lower price points. The immediate challenge for the bulls is to push price back above this $69,000 line to convert overhead resistance into support.
Chronology of a Summer Correction: From $70,000 to the July Bottom
The path to the current $64,672 spot price has been marked by significant volatility and shifting holder sentiment. In early June, Bitcoin appeared to be consolidating for an assault on its previous all-time highs. However, a combination of factors—including significant selling by the German Federal Criminal Police Office (BKA), which liquidated nearly 50,000 BTC, and the commencement of repayments by the defunct Mt. Gox exchange—introduced substantial supply into the market.
By early July, the market entered a phase of acute stress. Long-term holders (LTH), typically known for their "diamond hands," began realizing losses at rates not seen since the collapse of the FTX exchange in late 2022. On July 8, Glassnode data revealed that long-term holder loss realization accounted for a staggering 43% of total realized value. The entity-adjusted LTH realized loss measure peaked near $280 million per day during this window.
Despite this pressure, the market found a base as buyers absorbed the June and early July lows. This absorption prevented a full descent to the $52,891 realized price, suggesting that demand remains present, albeit cautious. By July 15, the tone of the on-chain data began to shift. The realized loss series for long-term holders turned downward from its cycle peak for the first time in weeks, suggesting that the most intense selling pressure from this group had been exhausted.
Holder Dynamics: The Battle Between Short-Term and Long-Term Cohorts
The current market environment highlights a fascinating tug-of-war between two primary investor cohorts. Short-term holders, defined as those who have held their coins for less than 155 days, are currently the most vulnerable. With Bitcoin trading below the $69,000 STH cost basis, the majority of recent entrants are holding unrealized losses. If the price remains suppressed, these investors may become a source of "exit liquidity," selling into any minor rallies and creating overhead resistance.

Conversely, long-term holders provide the market’s structural backbone. While their recent loss realization was high, the cooling of this trend is a prerequisite for any sustained recovery. The fact that the market stabilized above the realized price during the peak of the German government’s selling spree is viewed by many analysts as a sign of underlying strength.
However, a deeper decline toward the $52,900 level would test these groups in sequence. First, recent buyers would be pushed into deeper losses, likely triggering another wave of panic selling. Only after that would the broader, aggregate holder base approach their break-even point at the realized price. The outcome of such a test would depend entirely on whether the buyers who stepped in during the June lows are willing to defend their positions or if they, too, will succumb to the pressure of a potential bear-regime transition.
Institutional Influence and the Missing Demand Confirmation
While the cooling of sell-side pressure is a positive development, the "demand" side of the equation remains incomplete. Institutional participation, largely channeled through US-based Spot Bitcoin ETFs, has been inconsistent. Following the launch of these products in January 2024, they provided a massive tailwind for price. However, during the June and July correction, the "institutional bid" appeared to waver.
Reports from mid-July provide a conflicting picture of institutional activity. While some data points indicated a return to net inflows for ETFs like BlackRock’s IBIT and Fidelity’s FBTC, other weekly reports suggested that redemptions had merely slowed rather than being replaced by a sustained, aggressive bid. This lack of "broad buying conviction" is reflected in the spot cumulative volume delta (CVD), which remained negative during much of the recent price recovery.
Essentially, the market is currently experiencing a "seller exhaustion" rally rather than a "buyer-driven" breakout. Price is moving higher because there are fewer people willing to sell at these levels, not necessarily because there is a surge of new money entering the space. For a true higher low to be confirmed, spot activity must show a transition to positive CVD, indicating that buyers are once again taking control of the price discovery process.
Implications and the Path to Recovery
The road ahead for Bitcoin is defined by two major milestones. The first is the aforementioned reclaim of the $69,000 Short-Term Holder Cost Basis. A sustained move above this level, ideally supported by high trading volume, would signal that the market has moved past the immediate trauma of the June correction. It would effectively "neutralize" the sell-side pressure from recent buyers and turn a psychological barrier into a support zone.
The second, more significant threshold is the True Market Mean, which sat at $76,600 as of July 8. This level represents the average cost basis of the "active" market—investors who have been involved in the current cycle. Reclaiming the True Market Mean would be a definitive signal that Bitcoin has exited its "deep-value" phase and has re-entered a broad bullish regime.
Until these levels are breached, the $52,891.91 realized price remains a relevant marker of downside risk. While the July data provides evidence that a bottom may be forming above this level, the transition is not yet complete. Market participants are watching for three key signals to confirm a bullish continuation:
- Sustained ETF Inflows: A string of consecutive days of net positive inflows into US spot ETFs to demonstrate institutional commitment.
- Cooling LTH Losses: Continued reduction in the amount of Bitcoin being sold at a loss by veteran holders.
- Spot CVD Pivot: A shift in trading volume that shows aggressive market-buy orders outweighing market-sell orders.
In the absence of these signals, Bitcoin remains in a state of tentative stabilization. The current 18.22% gap between the spot price and the realized price serves as a buffer, but in the volatile world of digital assets, such gaps can close quickly if macroeconomic conditions deteriorate or if institutional demand fails to materialize. For now, the market is in a wait-and-see mode, perched between the hope of a $69,000 recovery and the structural reality of a $52,900 floor.