James Watt
The global cryptocurrency market is currently navigating a complex intersection of recovering institutional interest and deteriorating macroeconomic conditions, leaving Bitcoin’s recent price stabilization vulnerable to external shocks. While spot Bitcoin exchange-traded funds (ETFs) in the United States have finally returned to a regime of positive inflows, this momentum is being countered by a significant contraction in exchange liquidity and a resurgence of geopolitical volatility. As Brent crude oil prices climb above $90 per barrel amid military escalations in the Middle East, the narrative of easing inflation—which had previously bolstered risk assets—is facing its most rigorous test of the year.
Data from market analytics platforms, including CryptoSlate and SoSoValue, indicate that Bitcoin has managed to maintain a foothold near the $64,000 level. This follows an arduous eight-week period of investor retreats that saw billions of dollars exit the ecosystem. However, the underlying market structure remains fragile. Stablecoin reserves on major trading platforms are experiencing a sustained decline, effectively reducing the "dry powder" available to buyers. This divergence between headline ETF success and on-chain liquidity suggests that the path to a sustainable breakout above long-standing resistance levels remains fraught with structural obstacles.
Geopolitical Instability and the Return of the Energy Shock
The primary catalyst for the renewed pressure on global markets is the escalating conflict involving the United States and Iran, specifically centered on the Strait of Hormuz. As one of the world’s most vital energy transit points, any disruption to the strait carries immediate consequences for global supply chains and inflationary expectations. On July 20, the United States Central Command (CENTCOM) confirmed that American forces had executed a ninth consecutive evening of targeted strikes against Iranian military infrastructure. According to official military statements, the operations were aimed at degrading Iran’s capacity to threaten commercial shipping and civilian mariners.
The targets of these strikes were comprehensive, including military command centers, air-defense systems, coastal-surveillance sites, and drone launch positions. While the military objective was the protection of maritime commerce, the economic reaction was swift. Brent crude, the international benchmark for oil prices, surged to a one-month high, surpassing $91 per barrel. This price action reflects a growing "war premium" as markets account for the possibility of prolonged interruptions in the Persian Gulf.

Shipping data cited by Reuters further illustrates the severity of the situation. Reports indicate that no liquefied natural gas (LNG) tankers have transited the Strait of Hormuz since the middle of the week, and broader vessel traffic has seen a precipitous decline. On a recent Sunday, only four vessels moved through the waterway, a 50% decrease from the eight vessels recorded the previous day. This bottleneck has led to a backlog of tankers in the Gulf, as operators wait for security conditions to stabilize before proceeding through the chokepoint.
The Inflation Narrative and Federal Reserve Policy
The surge in energy prices directly threatens the disinflationary trend that had recently provided a tailwind for Bitcoin. Prior to the escalation in the Middle East, softer-than-expected inflation data from the United States had led many analysts to believe the Federal Reserve might soon have the latitude to pivot toward a more accommodative monetary policy. Lower interest rates typically enhance the attractiveness of non-yielding assets like Bitcoin while lowering the opportunity cost of moving away from fixed-income securities.
However, if oil prices remain elevated above the $90 threshold, the resulting increase in transportation and production costs could seep back into consumer price indices. This scenario would likely force the Federal Reserve to maintain a restrictive policy stance for longer than the market currently anticipates. Simon-Peter Massabni, head of business development at XS.com, noted that the market is now caught between these opposing forces. While the previous narrative focused on cooling inflation, the "oil shock" introduces a new variable that could reverse those expectations, making Bitcoin’s recovery reliant on a macro-environment that is rapidly shifting toward uncertainty.
Analyzing the ETF Rebound: Breadth vs. Depth
In the midst of this macro-volatility, the U.S. spot Bitcoin ETF market has shown signs of life, recording two consecutive weeks of net inflows. For the week of July 13 through July 17, these products attracted $75.67 million, building on a more robust $197.40 million intake from the prior week. This combined $273 million reversal is significant, as it follows a grueling two-month period where investors withdrew more than $8 billion from the space.
Despite the positive headline figures, a closer look at the data reveals a high degree of concentration. The recovery has been disproportionately driven by BlackRock’s iShares Bitcoin Trust (IBIT), which recorded approximately $204 million in inflows during the most recent tracking period. This figure actually exceeded the net total for the entire market, meaning that gains in BlackRock’s fund and Grayscale’s Bitcoin Mini Trust were being offset by continued outflows in other major products, such as Fidelity’s Wise Origin Bitcoin Fund.
This lack of broad-based demand across the various ETF issuers suggests that institutional appetite is not yet universal. While the selling pressure that characterized the previous eight weeks appears to be exhausting itself, the current "recovery" lacks the diversity of participation necessary to signal a full-scale market reversal. Without a wider distribution of capital across the ETF landscape, the current price floor near $60,000 remains susceptible to sudden shifts in sentiment.
The $2.3 Billion Liquidity Vacuum
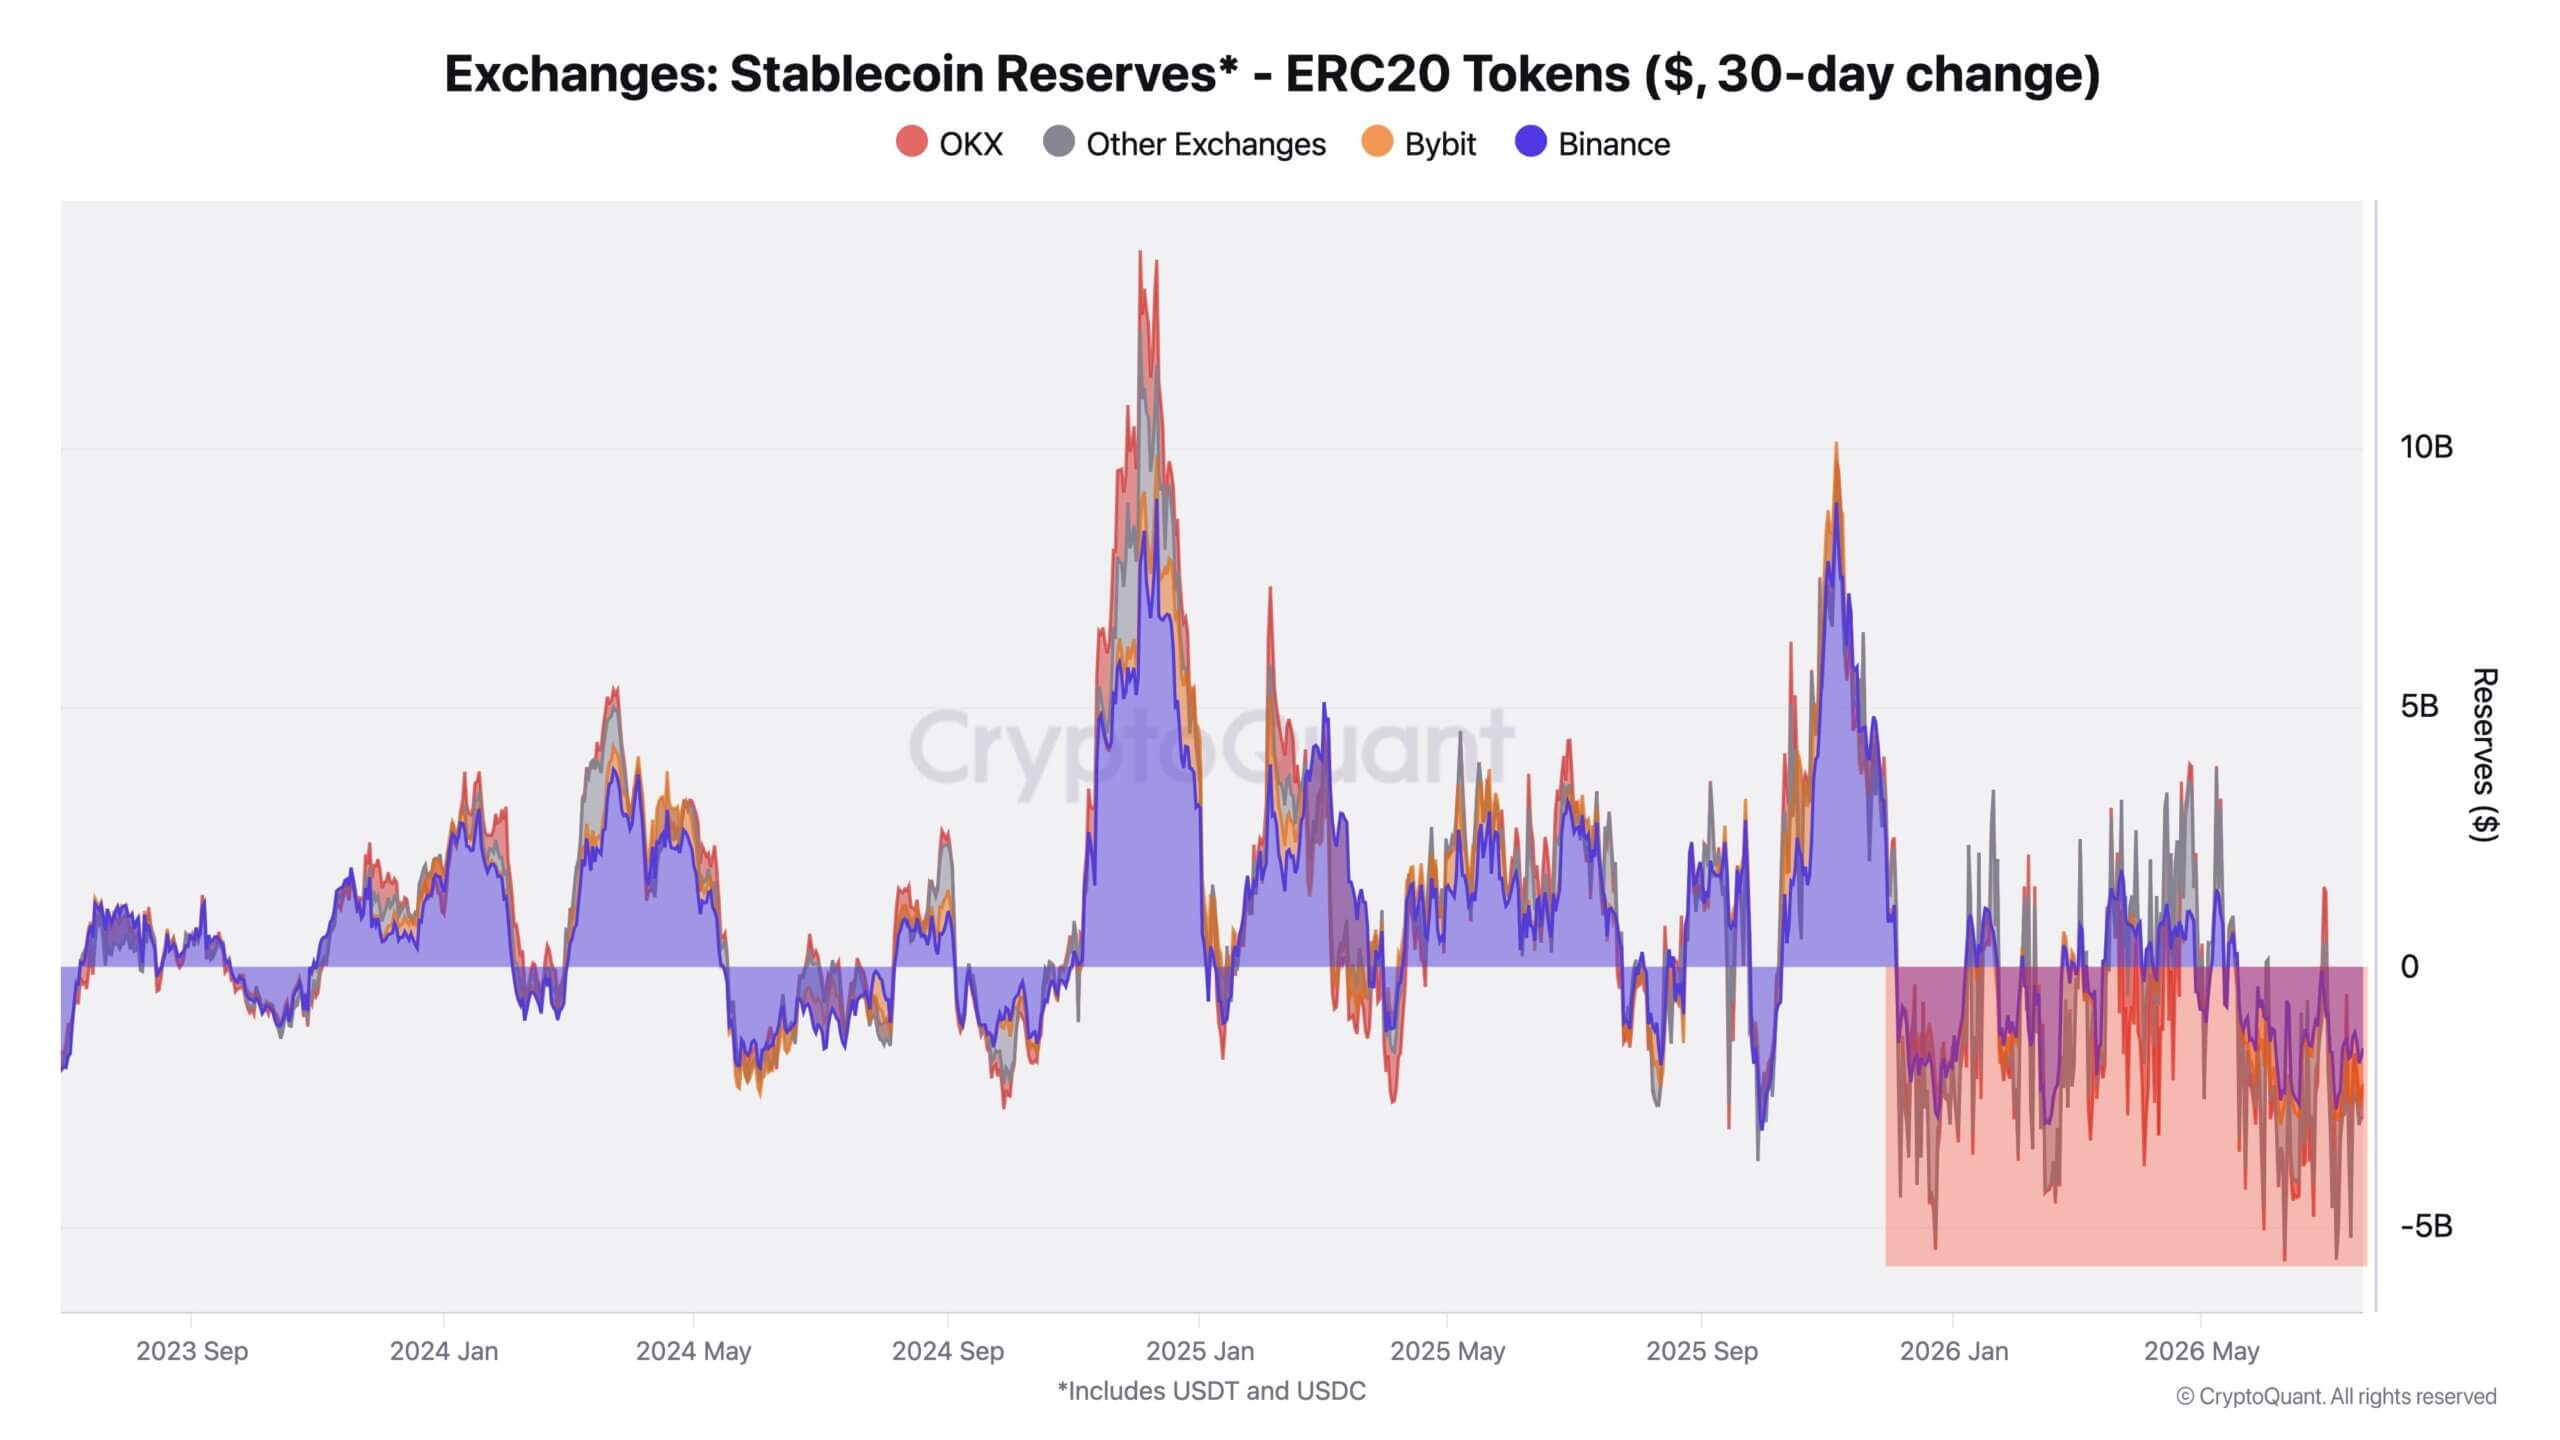
Perhaps the most concerning metric for Bitcoin bulls is the ongoing exodus of stablecoins from centralized exchanges. Stablecoins like USDT and USDC serve as the primary bridge between traditional fiat currency and digital assets. When stablecoin reserves on exchanges fall, it generally indicates that traders are moving capital off-platform or converting their holdings back into fiat, thereby reducing the immediate purchasing power available to support asset prices.
Analysis of CryptoQuant data shows a sharp contraction in these reserves. Binance, the world’s largest cryptocurrency exchange by volume, saw a reduction of approximately $1.55 billion in stablecoin holdings over a 30-day period. Simultaneously, Bybit recorded a decline of $786 million. This combined withdrawal of nearly $2.3 billion represents a significant loss of market liquidity. This "liquidity vacuum" explains why Bitcoin has struggled to maintain momentum above the $65,000 resistance level; there is simply less available capital on the sidelines to chase the price higher or to absorb large sell orders.
Market analysts, including Darkfost from CryptoQuant, have highlighted that Bitcoin has spent nearly 165 days testing the lower boundaries of its current trading range. While buyers have been successful in defending the $60,000 level thus far, the persistent drain on exchange reserves suggests that these defenses are thinning.
Derivatives and the Risk of a "Long Flush"
The combination of low spot liquidity and high leverage in the derivatives market has created a "gravitational pull" toward specific price levels. Data from the analytics platform Alphractal points to a dangerous concentration of leveraged long positions clustered between $55,000 and $57,000. These are traders who have borrowed capital to bet on a price increase and whose positions will be automatically liquidated if the price falls to those levels.
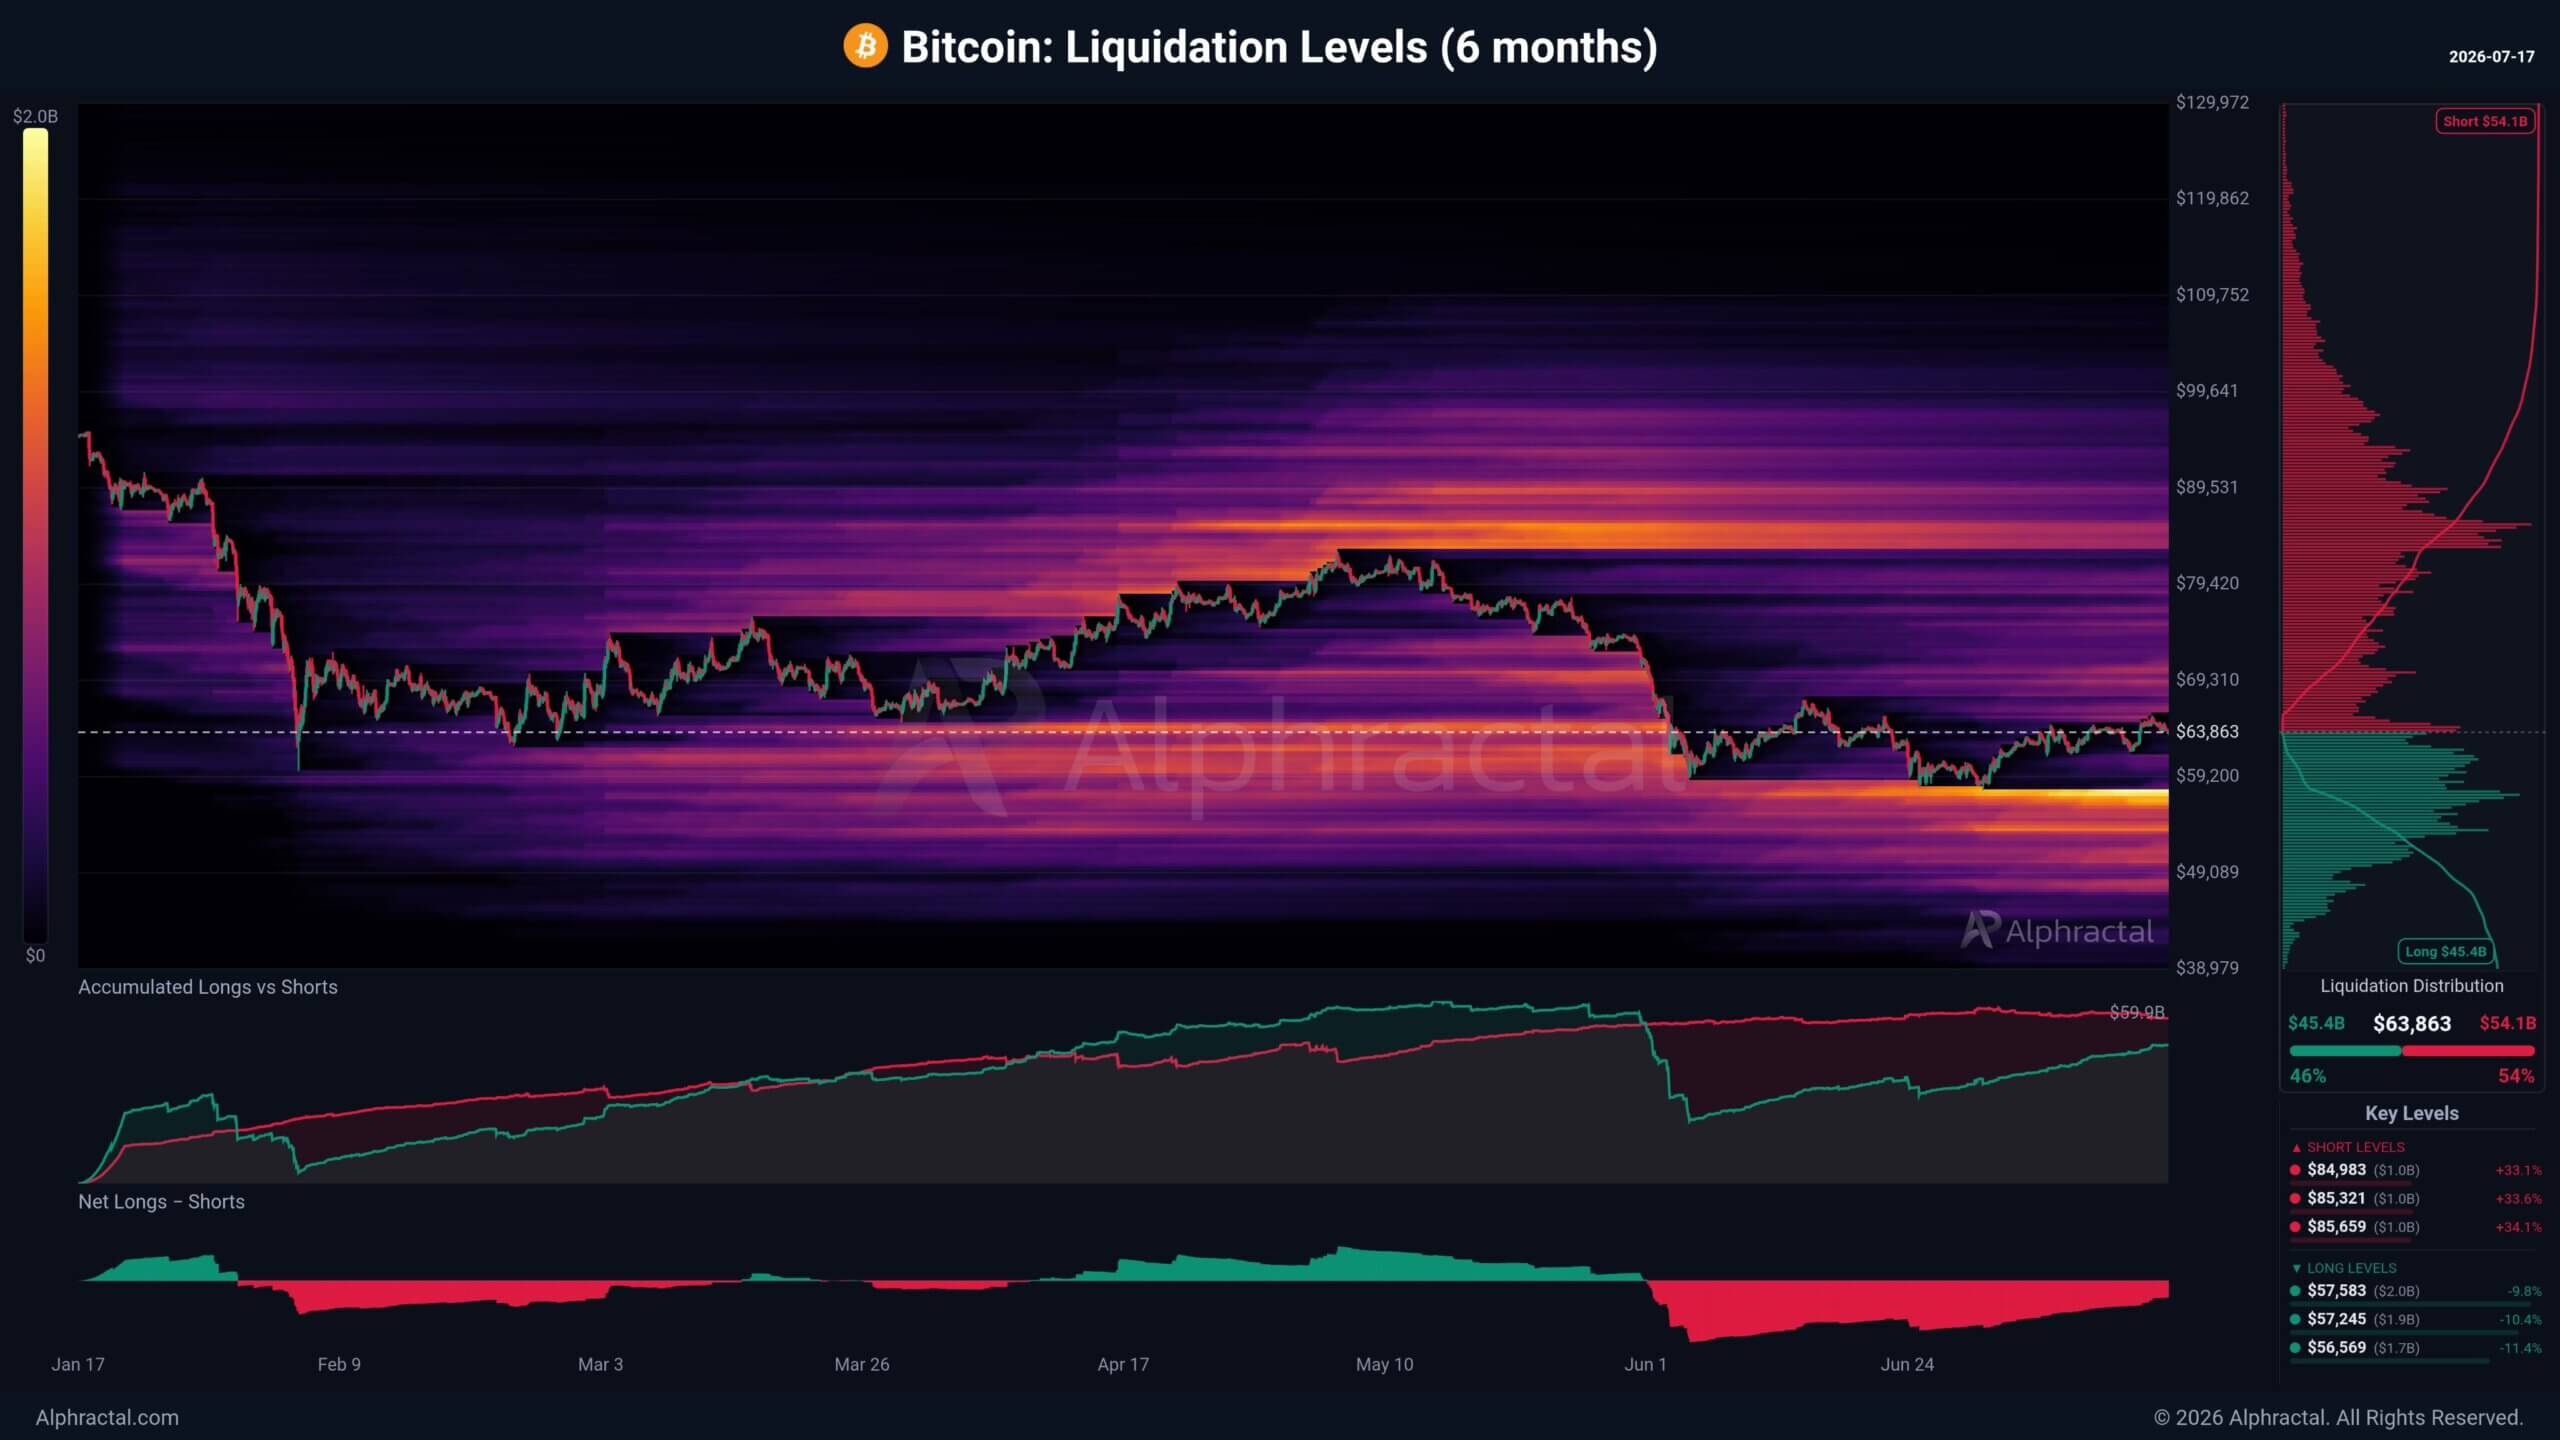
In contrast, the liquidity pools for short sellers—those betting on a price decrease—are much further away, residing primarily in the $82,000 to $84,000 range. This imbalance means that the path of least resistance in the short term may be to the downside. If a negative macroeconomic catalyst, such as a further spike in oil or a return to ETF outflows, pushes Bitcoin below its current support, it could trigger a "liquidation cascade." In such a scenario, the forced selling of long positions would drive the price down further, triggering even more liquidations in a self-reinforcing cycle that could see Bitcoin test the $50,000 range.
Sentiment Indicators and Future Outlook
Despite these structural risks, some indicators suggest that a tactical bottom may be forming. The proprietary Greed & Fear Index from BIT Official has shown a gradual upward trend in its 21-day moving average. Historically, such movements have often preceded periods of price appreciation, suggesting that the $60,000 to $65,000 zone could serve as a foundational base if external pressures subside.
Independent analyst Michael Van de Poppe has argued that the current period of low volatility is a necessary phase for establishing "fundamental support." According to his analysis, the critical hurdle for the market is a sustained break above $65,000. If Bitcoin can flip this level from resistance to support, it would likely invalidate the bearish thesis and pave the way for a test of all-time highs. Conversely, a failure to hold $61,000 would almost certainly lead to a reckoning with the $57,000 liquidation pool.
As the market enters the next phase of this cycle, the focus remains on institutional consistency. Research firm BRN Research emphasized in a recent communication that the cryptocurrency ecosystem cannot afford a return to the negative institutional flows seen earlier this year. The $62,000 to $65,000 supply band is currently the "ultimate proving ground." It will either serve as the launchpad for a structural reversal or as a ceiling that eventually forces the market to reset at much lower levels. For now, Bitcoin remains a high-stakes barometer for global liquidity, caught between the promise of institutional adoption and the harsh realities of a volatile geopolitical landscape.