James Watt
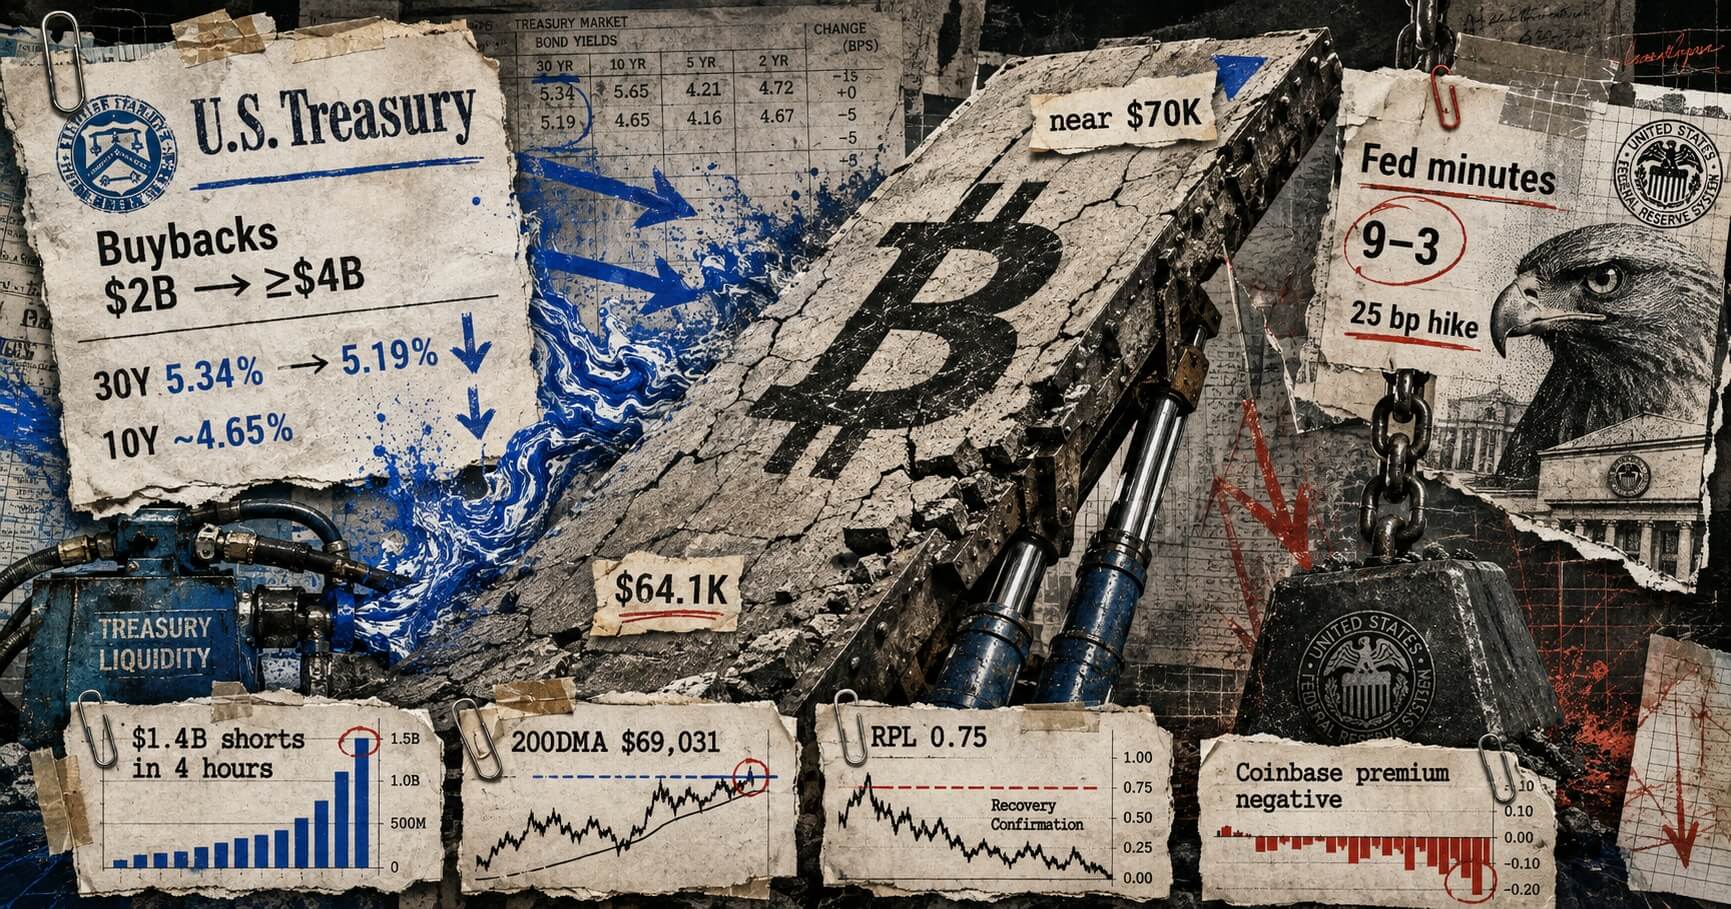
The global financial landscape witnessed a dramatic shift on August 19 as Bitcoin surged from approximately $64,100 to nearly $70,000 within a matter of hours, a move precipitated by the U.S. Treasury’s unexpected decision to double its planned buybacks of long-dated government debt. This strategic pivot by the Treasury effectively pushed sovereign bond yields lower, creating a ripple effect across risk assets that resulted in the forced liquidation of roughly $1.4 billion in cryptocurrency short positions in just a four-hour window. The volatility underscored the heightened sensitivity of the digital asset market to macroeconomic policy shifts, particularly those affecting the "risk-free" rate of return represented by U.S. Treasuries.
The Treasury’s Liquidity Injection and Market Reaction
The catalyst for the rally was an official statement from the U.S. Treasury Department announcing an increase in the maximum size of its liquidity-support buybacks. Specifically, the Treasury revealed it would raise the cap for 10-to-20-year and 20-to-30-year securities from the previously established $2 billion to at least $4 billion per operation. These operations are scheduled to run from September 9 through November 4. While the stated objective of the program is to improve liquidity in the secondary market for longer-dated Treasuries—which has faced periods of fragmentation and volatility—the immediate market interpretation was one of de facto monetary easing.
The impact on fixed-income markets was instantaneous. The 30-year Treasury yield, which had recently peaked near 5.34%, slid toward 5.19%. Similarly, the 10-year Treasury yield, a critical benchmark for global borrowing costs, retreated toward 4.65%. As bond yields fell, the opportunity cost of holding non-yielding assets like Bitcoin and gold decreased, sparking a broad-based "risk-on" rally. The U.S. Dollar Index (DXY) mirrored this sentiment, dropping 0.75% to 98.90, further fueling the upward trajectory of hard assets.
Decoding the Yield Curve Control Narrative
Within hours of the Treasury’s announcement, market participants and macro strategists began labeling the move as "implicit yield-curve control" (YCC). Historically, formal YCC involves a central bank committing to defend a specific interest rate target by purchasing an unlimited amount of government bonds. While the Treasury’s actions did result in a sharp decline in long-end yields, institutional analysts were quick to differentiate between liquidity support and a formal policy of yield suppression.
Jamie Patton, a strategist at TCW, cautioned that claims of the Treasury effectively capping yields might be premature and overstated. Patton noted that the forces driving global interest rates higher—including persistent inflation and massive fiscal deficits—are far larger than any single buyback program. With the total U.S. Treasury market valued at over $32 trillion, and approximately $5.5 trillion in 20- and 30-year debt outstanding, a $4 billion per-operation buyback is relatively small. Nevertheless, the psychological impact of the Treasury stepping in as a "buyer of last resort" for its own debt provided the necessary spark for the massive short squeeze in the crypto markets.
A Tale of Two Policies: The Federal Reserve’s Hawkish Counterpoint
The optimism generated by the Treasury’s liquidity measures was tempered later the same day by the release of the minutes from the Federal Reserve’s July Federal Open Market Committee (FOMC) meeting. The minutes revealed a central bank that remains deeply concerned about the persistence of inflation and the potential need for further monetary tightening.
According to the report, several FOMC participants expressed a preference for a 25-basis-point interest rate hike during the July meeting, though the committee ultimately voted 9 to 3 to hold rates at the 3.50% to 3.75% range. The dissenters—Hammack, Kashkari, and Logan—pushed for an immediate increase, citing upwardly skewed inflation risks. Furthermore, many officials questioned whether current financial conditions were sufficiently restrictive to return inflation to the Fed’s 2% target.
This hawkish tone from the Fed created a "policy tug-of-war." While the Treasury was actively injecting liquidity into the long end of the bond market, the Fed was signaling that the short-term "higher for longer" regime remains firmly in place. Rate markets reacted by pricing in better-than-even odds of another rate hike by October, with an even higher probability assigned to a December increase. This internal friction within U.S. financial leadership suggests that the recent relief rally in Bitcoin may face significant headwinds if the Fed continues to prioritize inflation suppression over market liquidity.
Bitcoin Technicals and the $69,000 Threshold
As Bitcoin surged toward the $70,000 mark, it encountered a significant technical and psychological barrier. The digital asset briefly traded above its 200-day moving average (DMA) of $69,031, a level often used by institutional traders to distinguish between a bullish and bearish long-term trend. However, sustaining a position above this level proved challenging.
On-chain data from Glassnode provided further context for this price action. The $69,000 to $70,000 zone corresponds closely with the cost basis of short-term holders, currently estimated at $68,500. This meant that the price spike carried Bitcoin directly into a zone where recent buyers were finally breaking even, leading to a natural increase in sell pressure. Furthermore, the "True Market Mean"—a metric representing the average price at which the wider active investor base acquired their holdings—sits significantly higher at approximately $75,800. This suggests that while the short squeeze cleared out bearish bets, it has not yet reached the level required to put the broader market back into a state of significant profit.
Ethereum and the Broader Crypto Ecosystem
Bitcoin was not the only beneficiary of the Treasury-induced volatility. Ethereum (ETH) registered an intraday gain of 21.7%, reaching a high of $2,333.65. The altcoin market generally followed Bitcoin’s lead, benefiting from the sudden drop in long-term yields. For much of the past quarter, high Treasury yields have acted as a vacuum for capital, drawing liquidity away from high-beta assets like Ethereum. The moment the Treasury signaled enhanced buybacks, that competitive pressure eased, allowing for a rapid repricing of the second-largest cryptocurrency.
Despite the price gains, underlying demand metrics remain mixed. The "Coinbase Premium," which measures the price difference between Bitcoin on Coinbase (representing U.S. institutional and retail spot demand) and global exchanges, has remained largely negative throughout this period of consolidation. This indicates that the rally was primarily driven by the liquidation of short positions on offshore derivative platforms rather than a sustained wave of U.S.-based spot buying.
September Headwinds: Corporate Issuance and AI Competition
The sustainability of this macro-driven rally will be tested in September, a month historically associated with market volatility and heavy corporate debt issuance. Analysts expect roughly $200 billion in new corporate bond offerings as companies return from the summer lull. Additionally, heavy borrowing from firms in the Artificial Intelligence (AI) sector is expected to compete for the same pool of investor capital that might otherwise flow into the Treasury or crypto markets.
Evidence of this "supply strain" was visible on August 20, when a $16 billion auction of 20-year Treasuries required a yield of 5.204%. This was slightly higher than the prevailing market rates just before the auction, indicating that real private buyers still demand a premium to hold long-duration government debt, regardless of the Treasury’s buyback intentions. This "tailing" auction partially reversed the gains seen in the Treasury market earlier that morning and acted as a drag on Bitcoin’s momentum.
Analyzing the Path Forward: Recovery or Local Rally?
To determine if the current move is the start of a genuine recovery or merely a "dead cat bounce" within a larger bottoming process, analysts are closely watching Glassnode’s Realized Profit/Loss Ratio. Currently, the ratio sits at 0.75. Historically, a move below 0.5 signals seller exhaustion, while a climb toward 2.0 confirms a sustainable bull market recovery. The current reading suggests the market is in a state of fragile equilibrium, having moved out of the extreme fear zone but lacking the momentum to confirm a new uptrend.
For a bullish thesis to hold, Bitcoin must maintain its position above the 200-DMA at $69,031 and see a transition in spot ETF flows. While U.S.-traded Bitcoin spot ETFs have stabilized after a period of outflows, they have yet to show the consistent, multi-week inflows necessary to suggest that institutional "real money" is replacing the forced buying of liquidated short-sellers.
Conversely, the bearish case rests on the potential for yields to resume their climb. If persistent inflation data or an overwhelming supply of new government and corporate debt pushes the 10-year and 30-year yields back toward their recent highs, the macro tailwind for Bitcoin will likely evaporate. In such a scenario, the market could see a retracement below the $68,500 short-term holder cost basis, potentially retesting lower support levels in the low $60,000s.
In summary, the events of August 19 and 20 highlight the complex interplay between fiscal policy, monetary signals, and digital asset pricing. While the U.S. Treasury provided a temporary reprieve for risk assets by bolstering market liquidity, the Federal Reserve’s steadfast commitment to its hawkish stance ensures that the path forward for Bitcoin remains fraught with macroeconomic uncertainty. The coming weeks will be crucial in determining whether the "August Squeeze" was a fleeting anomaly or the foundation of a more significant market shift.