James Watt
XRP has recorded a significant price surge of approximately 22% within a 24-hour window, reaching a trading value near $1.26 and successfully breaching a critical resistance level that market analysts had identified as a primary upside target as early as July. This price action marks a pivotal moment for the digital asset, as it moves beyond the $1.18 breakout line that had previously served as a focal point for traders and institutional observers. The move has been accompanied by a substantial increase in open interest, signaling a renewed wave of speculative activity and strategic positioning within the derivatives market. As the asset clears the $1.26 threshold, the focus of the market has shifted toward higher structural levels, with liquidation data suggesting that the current momentum may be fueled by a cascading short squeeze.
The technical framework that predicted this move was established during the mid-summer months when XRP’s consolidation patterns began to signal a potential volatility expansion. At that time, the $1.18 level was identified as the "breakout line," a price point where a sustained move would likely trigger a rapid acceleration in price due to the clearing of sell-side orders and the activation of momentum-following algorithms. By clearing $1.26, XRP has not only validated this earlier analysis but has also moved into a "price discovery" phase relative to its recent trading range, forcing market participants to recalibrate their expectations for the remainder of the quarter.
The Mechanics of the Short Squeeze and the Liquidation Ladder
A primary driver of the recent price appreciation is the "liquidation ladder" currently forming in the XRP derivatives market. Data from Hyperliquid and other major exchanges indicate a significant concentration of leveraged short positions that are now underwater. When an exchange forcibly closes a short position during a price rally—a process known as liquidation—the trader is required to buy back the asset to exit the trade. This involuntary buying adds a layer of artificial demand to the market, which can propel prices even higher, subsequently triggering the next tier of liquidations.
Current positioning data reveals a series of critical "trigger points" on the upside. Cumulative short liquidations are estimated at approximately $607,000 at the $1.28 level. If the price reaches $1.32, the liquidation volume is expected to climb to roughly $1.4 million. The most significant cluster of near-term short-side exposure sits at $1.38, where approximately $2.2 million in liquidations could be triggered. This level represents a 9.5% increase from the current spot price of $1.26. While these figures are influential, it is important to note that the total short-liquidation exposure across all price levels for XRP on Hyperliquid stands at $49.5 million. The $2.2 million cluster at $1.38 represents only about 4.4% of that total, suggesting that while a squeeze to $1.38 is a high-probability near-term target, it does not inherently guarantee a move to much higher levels without sustained spot buying.
Funding rates provide additional context for this move. Currently, funding remains moderately positive at 0.0100% over an eight-hour period. In the crypto-derivatives market, positive funding indicates that long-position holders are paying short-position holders, signaling a bullish tilt in market sentiment. However, the current reading is far from the "crowded" or euphoric levels typically seen before a major market reversal. This suggests that the rally still has room to breathe and is not yet exhausted by over-leveraged retail speculation.
Chronology of Recent XRP Movements and Supply Dynamics
The path to $1.26 has been marked by several key on-chain events and institutional movements over the past several weeks. Understanding the timeline of these events is crucial for assessing the sustainability of the current rally.
On August 13, a Ripple-linked operational address initiated a transfer of 50 million XRP. Of this total, 1 million XRP was sent to a Binance-linked address, while the remaining 49 million XRP was moved to an unidentified wallet. This movement initially sparked concerns regarding potential sell-side pressure; however, the bulk of the tokens has remained dormant in the secondary wallet since the transfer.
Following this, on August 17, Santiment tracked a massive spike in dormant supply activity. Approximately 1.1% of the total circulating XRP supply—coins that had remained untouched for an average of 518.95 days—moved in a single day. This level of activity is roughly 25 times the normal rate for dormant supply movement. Interestingly, exchange volume did not spike in tandem with this movement, suggesting that these were likely wallet-to-wallet transfers rather than immediate liquidation on the open market. Nevertheless, the sudden awakening of "old" coins often precedes periods of high volatility, as it indicates that long-term holders or large-scale entities are repositioning their assets.
The broader market context also played a decisive role. On August 20, Bitcoin registered an intraday high of $72,966, providing a bullish backdrop for the entire altcoin sector. This move in Bitcoin was largely attributed to a policy shift by the U.S. Treasury, which announced it would double the size of its buybacks for long-duration debt. This move was intended to suppress long-term yields, which had recently hit their highest levels since 2007. The resulting relief across risk assets, combined with a softening U.S. Dollar Index (DXY)—which fell to 98.90—created a "perfect storm" for XRP to capitalize on its technical breakout.
Structural Resistance: The $1.40 to $1.50 Barrier
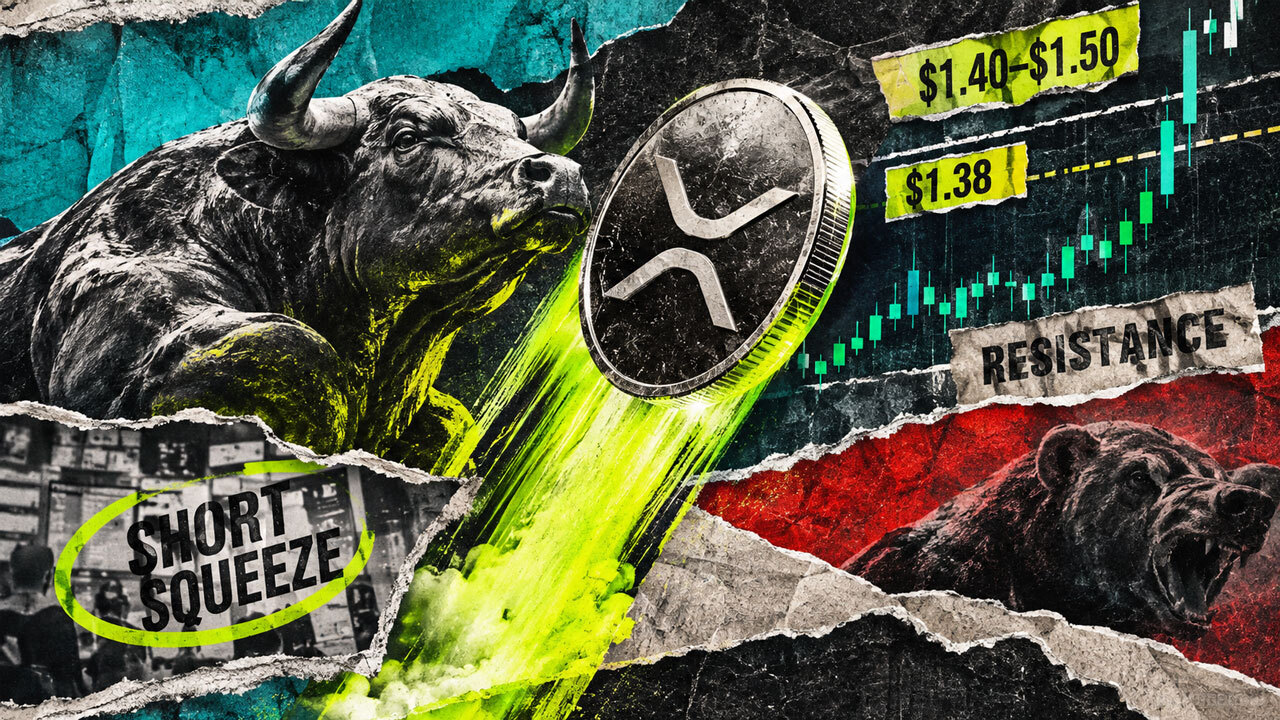
While the $1.38 squeeze target is the immediate focus for intraday traders, the $1.40 to $1.50 range represents the true structural test for XRP. This zone has acted as a formidable ceiling for several months and is considered the "make-or-break" level for the asset’s long-term trajectory.
Technical analysts argue that a move through $1.50 is required to turn the broader chart decisively bullish, moving the narrative beyond a simple "short-covering bounce." If XRP can sustain a daily close above $1.50, it would signal a shift in market structure that could open the door for extension targets between $1.60 and $1.73. However, these higher levels remain speculative until the $1.40–$1.50 resistance band is successfully converted into a support floor.
Conversely, the risk of a "failed squeeze" remains present. If momentum fades before reaching $1.38, or if the asset rejects the $1.40 resistance, a pullback is likely. A reversal to $1.19 would expose approximately $525,000 in cumulative long liquidations. If the price falls further to $1.13—a drop of roughly 10.3% from current levels—the market would face a mirror image of the current squeeze, with $2.1 million in long liquidations potentially fueling a rapid descent.
The Role of Institutional and Macroeconomic Factors
The current rally is occurring against a complex macroeconomic backdrop. The July Federal Open Market Committee (FOMC) minutes revealed a cautious Federal Reserve, with officials voting to hold the funds rate at 3.50% to 3.75%. While the majority of officials favored a pause, three members dissented in favor of a rate hike, highlighting the ongoing debate regarding inflation and economic growth.
For XRP, which is often sensitive to regulatory and institutional news, these macro factors are compounded by its unique position in the digital asset space. The ongoing monitoring of the 49 million XRP block currently sitting in an unidentified wallet is a key variable. Should this supply move toward an exchange, it could provide the necessary liquidity for buyers to exit, or it could overwhelm the current demand, leading to a price rejection at resistance.
Market observers note that the "supply shock" potential is high. If the short squeeze continues to provide forced buying pressure, it may absorb any potential selling from these large blocks. However, if the squeeze loses steam just as dormant supply hits the market, the reversal could be sharp.
Summary of Market Scenarios and Outlook
As XRP navigates the volatility between $1.26 and $1.50, the market is effectively in a tug-of-war between derivative-driven momentum and structural supply. The bull case relies on three factors: continued forced short-covering, a stable or declining U.S. Treasury yield environment, and the continued dormancy of large-scale XRP holdings. If these conditions hold, the path to $1.38 appears clear, with a subsequent test of the $1.40–$1.50 zone likely.
The bear case centers on the exhaustion of the short squeeze. If the "liquidation ladder" is climbed and no new spot buyers emerge to take the baton, the asset risks a "bull trap" scenario. This would be accelerated if the DXY finds support or if the Fed signals a more hawkish stance in upcoming communications. Furthermore, the 49 million XRP block remains a "Damocles’ sword" hanging over the market; its movement to an exchange would be the primary signal for a potential trend reversal.
In conclusion, XRP has successfully cleared its immediate hurdle, but the path ahead is fraught with structural challenges. The transition from a short-squeeze-driven rally to a sustained bullish breakout will require more than just liquidations—it will require a fundamental shift in demand and a definitive clearing of the multi-month resistance at $1.50. Investors and traders alike are advised to monitor the $1.28 and $1.32 levels as early indicators of whether this move has the strength to reach its primary objective at $1.38 and beyond.