James Watt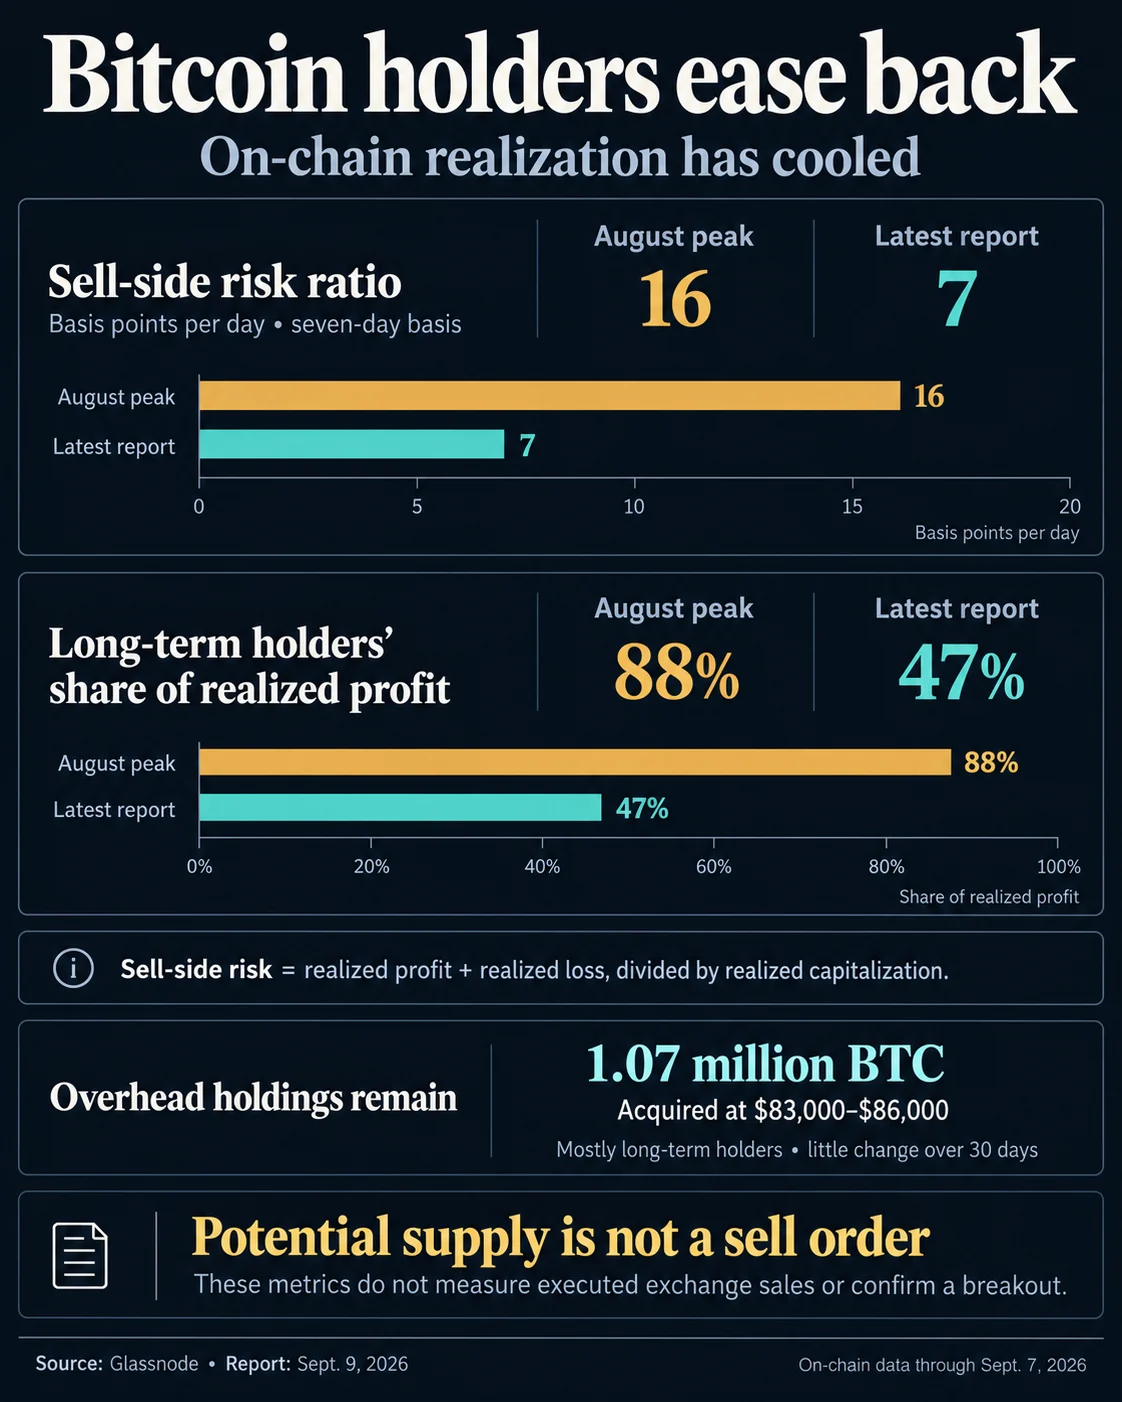
According to the latest data from blockchain analytics firm Glassnode, the Sell-Side Risk Ratio for Bitcoin fell to 7 basis points (bps) per day on a seven-day moving average as of September 7, 2026. This represents a sharp contraction from the 16 bps recorded during the height of market volatility in August. This metric, which serves as a vital barometer for potential selling exhaustion or impending volatility, suggests that the current environment is characterized by a relative equilibrium where holders are less inclined to move assets at current valuations.
The shift in holder behavior is further underscored by the composition of realized profits. Long-term holders (LTHs)—investors who have held their Bitcoin for at least 155 days—accounted for only 47% of realized profits in the first week of September. This is a dramatic departure from August, when this cohort was responsible for a staggering 88% of all realized profits. The reduction in profit-taking by veteran investors typically signals a transition from active distribution to a phase of re-accumulation or "HODLing," providing a potential floor for price action.
Understanding the Sell-Side Risk Ratio and Market Mechanics
To appreciate the significance of the drop from 16 to 7 basis points, it is necessary to understand the underlying mechanics of the Sell-Side Risk Ratio. Glassnode calculates this ratio by summing the absolute value of all realized profits and losses on-chain and dividing that total by the Realized Capitalization. The Realized Capitalization itself is a measure of the total value of all Bitcoins at the price they were last moved, rather than their current market price.
When the Sell-Side Risk Ratio is high, it indicates that investors are realizing a large amount of value relative to the total cost basis of the network. This often occurs during periods of extreme price discovery—either to the upside, where long-term holders "exit" into strength to lock in gains, or to the downside, where panic selling occurs. Conversely, a low ratio, such as the current 7 bps, indicates that most coins being moved are doing so at prices very close to their original acquisition cost. This suggests a state of "value equilibrium," where both sellers and buyers have reached a temporary stalemate, and the market may be waiting for a new catalyst to spark the next major trend.
While a lower ratio indicates reduced immediate sell pressure, it does not necessarily equate to a decrease in exchange-traded volume. Instead, it reflects a decrease in the intensity of profit and loss realization relative to the network’s size.
Chronology of the August-September Shift
The transition from the high-risk environment of August to the relative calm of early September followed a period of intense price fluctuation. In early August 2026, Bitcoin experienced a surge in volatility that saw the Sell-Side Risk Ratio climb to 16 bps. During this window, older coins that had been dormant for months or years were moved in large quantities. This "distribution" phase is typical when Bitcoin approaches previous all-time highs or significant psychological resistance levels, as veteran investors seek to de-risk their portfolios.
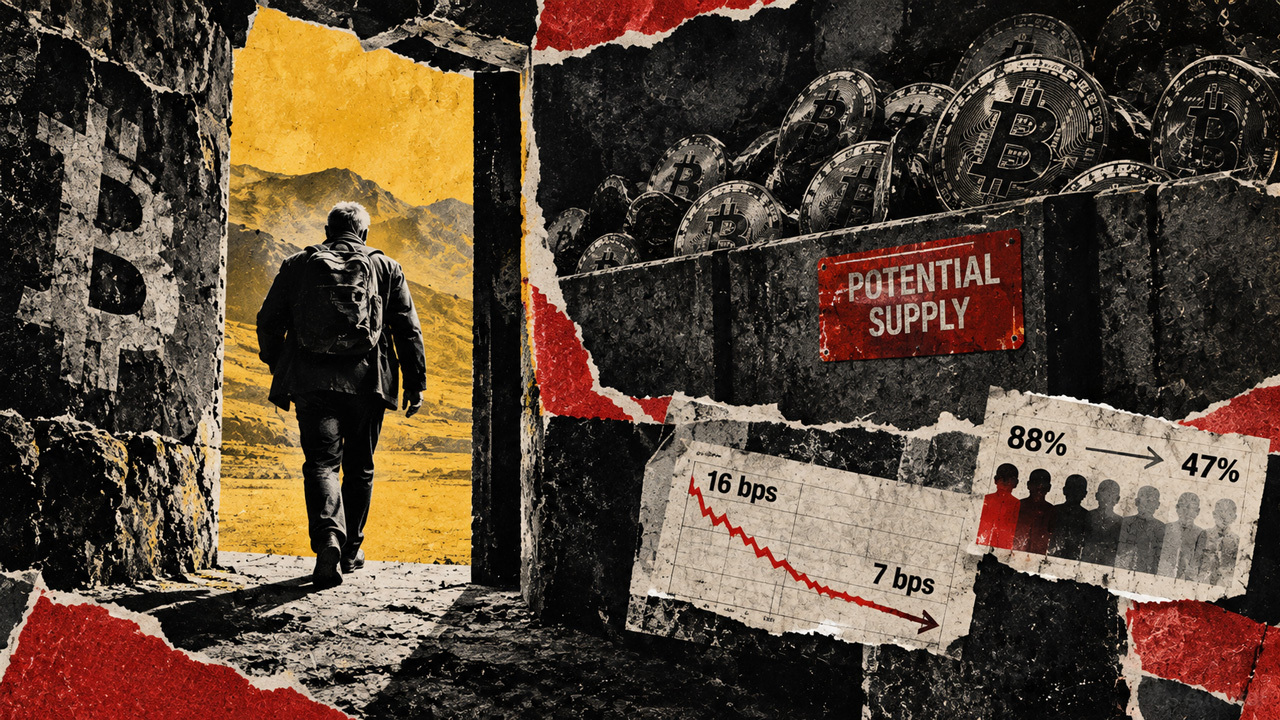
By the final week of August, the intensity of this distribution began to wane. The realized profit spike observed on September 3 was notably less than half the size of the spikes seen just three weeks prior. This deceleration suggests that the cohort of investors willing to sell at current price levels has been largely exhausted.
As of September 9, 2026, the market entered a consolidation phase. While the price of Bitcoin sat at approximately $77,000—representing a 1.59% decline over a 24-hour period—the broader 30-day and 90-day trends remained positive, with gains of 19.78% and 20.17%, respectively. This context is crucial: the cooling of sell-side risk is occurring against a backdrop of a medium-term uptrend, which many analysts interpret as a "bullish consolidation."
The 1.07 Million BTC Overhead Supply
One of the most critical findings in the recent on-chain report is the identification of a massive supply block held by long-term holders. Approximately 1.07 million BTC were acquired at price points between $83,000 and $86,000. Because the current market price is hovering below this range, these holders are technically "in the red" or "underwater."
Data shows that this specific block of supply has remained virtually unchanged over the past 30 days. The lack of movement in this cohort is a double-edged sword for the market. On one hand, it demonstrates the high conviction of these investors; despite being at a loss, they have refused to engage in panic selling. On the other hand, this 1.07 million BTC represents significant "overhead supply." Should the price of Bitcoin return to the $83,000–$86,000 range, these investors may look to "break even," creating a formidable wall of resistance that could cap further gains.
The behavior of this group in the coming weeks will likely dictate whether Bitcoin can successfully challenge its previous highs or if it will remain range-bound. If these holders continue to abstain from selling as the price approaches their entry point, it would signal a shift toward even higher price targets.
Exchange Demand and Spot Cumulative Volume Delta
While on-chain data tracks the movement of coins between wallets, exchange data provides a real-time look at buyer and seller aggression. Recent reports indicate that exchange spot flow remained slightly negative as of September 8. The Spot Cumulative Volume Delta (CVD)—a metric that measures the net difference between buying and selling volume—stayed in negative territory, though it showed signs of improvement.
A negative CVD implies that "market" sell orders (aggressive selling) are still slightly outpacing "market" buy orders. However, the fact that the Sell-Side Risk Ratio is falling while CVD improves suggests that the selling occurring on exchanges is becoming less "heavy." The sellers are no longer the long-term holders realizing massive profits, but rather short-term traders or speculators engaging in minor price hedging.

The divergence between on-chain stability and exchange-side selling creates a complex picture. For a sustained price advance to occur, the market requires a return of positive spot demand to absorb the remaining supply that enters the market. Analysts noted that while the "sell-side" is exhausting, the "buy-side" has yet to launch a full-scale offensive.
Broader Market Implications and Analyst Reactions
The cooling of Bitcoin’s sell-side risk is being viewed by institutional analysts as a necessary "reset" for the market. Following the aggressive profit-taking of August, the current reduction in realized profit share among long-term holders (from 88% to 47%) suggests that the "smart money" is once again waiting.
Market observers suggest that several external factors may be influencing this behavior:
- Macroeconomic Stability: With global central banks signaling a shift in interest rate policies, long-term holders may be holding onto their assets in anticipation of a weaker dollar and increased liquidity in late 2026.
- Institutional Adoption: The continued growth of Bitcoin ETFs and institutional custody solutions has created a "sink" for supply, where coins are moved into cold storage and removed from active circulation.
- The Halving Cycle Context: As the market moves further away from the 2024 halving, the reduced daily issuance of new Bitcoin is beginning to exert more pressure on the available supply, making existing holders more reluctant to part with their assets.
Inferred reactions from major trading desks suggest a "cautious optimism." While the 1.07 million BTC overhead supply is a known risk, the lack of selling at current levels indicates that the market floor is strengthening. Traders are reportedly keeping a close eye on the $80,000 psychological level; a break above this with rising spot CVD would likely invalidate the "break-even" selling threat from the $83k–$86k cohort.
Conclusion: A Market in Transition
Bitcoin’s current on-chain profile depicts a market that has successfully absorbed a significant period of profit-taking. The 56% drop in the Sell-Side Risk Ratio is a testament to the resilience of the current price levels and the shifting sentiment of long-term investors.
However, the road ahead is not without obstacles. The "parked" supply of over one million Bitcoin above the current market price remains a dormant volcano that could erupt if sentiment sours. Furthermore, the reliance on spot demand to absorb exchange selling means that Bitcoin remains sensitive to short-term macroeconomic shifts.
For now, the data suggests that the "sell-side" has done its part in cooling the market’s overheated engines. The focus now shifts to the "buy-side." As long-term holders step back and wait, the stage is set for the next influx of capital to determine whether Bitcoin will break through its overhead resistance or continue its period of quiet consolidation. With a market capitalization of $1.54 trillion and daily volumes remaining robust at nearly $30 billion, Bitcoin continues to consolidate its position as the premier digital reserve asset, awaiting the next spark of volatility.