James Watt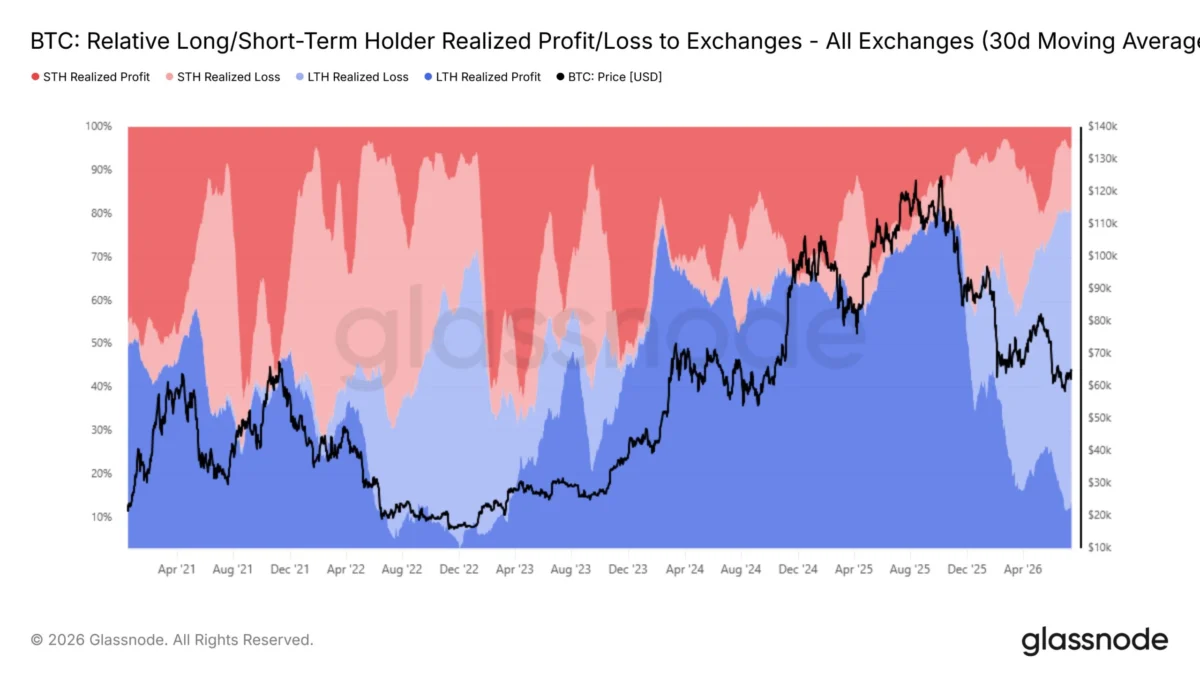
The digital asset market experienced a significant moment of volatility this week as Bitcoin’s latest attempt at a sustained recovery faltered, highlighting a complex interplay between institutional demand and retail exhaustion. After briefly surging past the $65,000 threshold on Wednesday—a level not seen in approximately a month—the world’s largest cryptocurrency by market capitalization retreated to trade below $63,000 by Friday. This price action serves as a stark reminder of the significant supply overhang that continues to plague the market, as both long-term investors looking to mitigate losses and short-term traders seeking to lock in quick profits converge to create a formidable ceiling for the asset.
The initial catalyst for the rally was the release of softer-than-expected United States inflation data, which provided a momentary boost to risk assets across the board. For a brief window, Bitcoin demonstrated its strongest correlation to favorable macroeconomic news in several weeks. However, the momentum proved insufficient to overcome the structural resistance levels established during the market’s downturn in June. As the price approached the $66,000 mark, a surge of sell orders hit the order books, suggesting that many market participants are currently more interested in liquidity than in betting on a move toward new all-time highs.

The Anatomy of the Supply Overhang
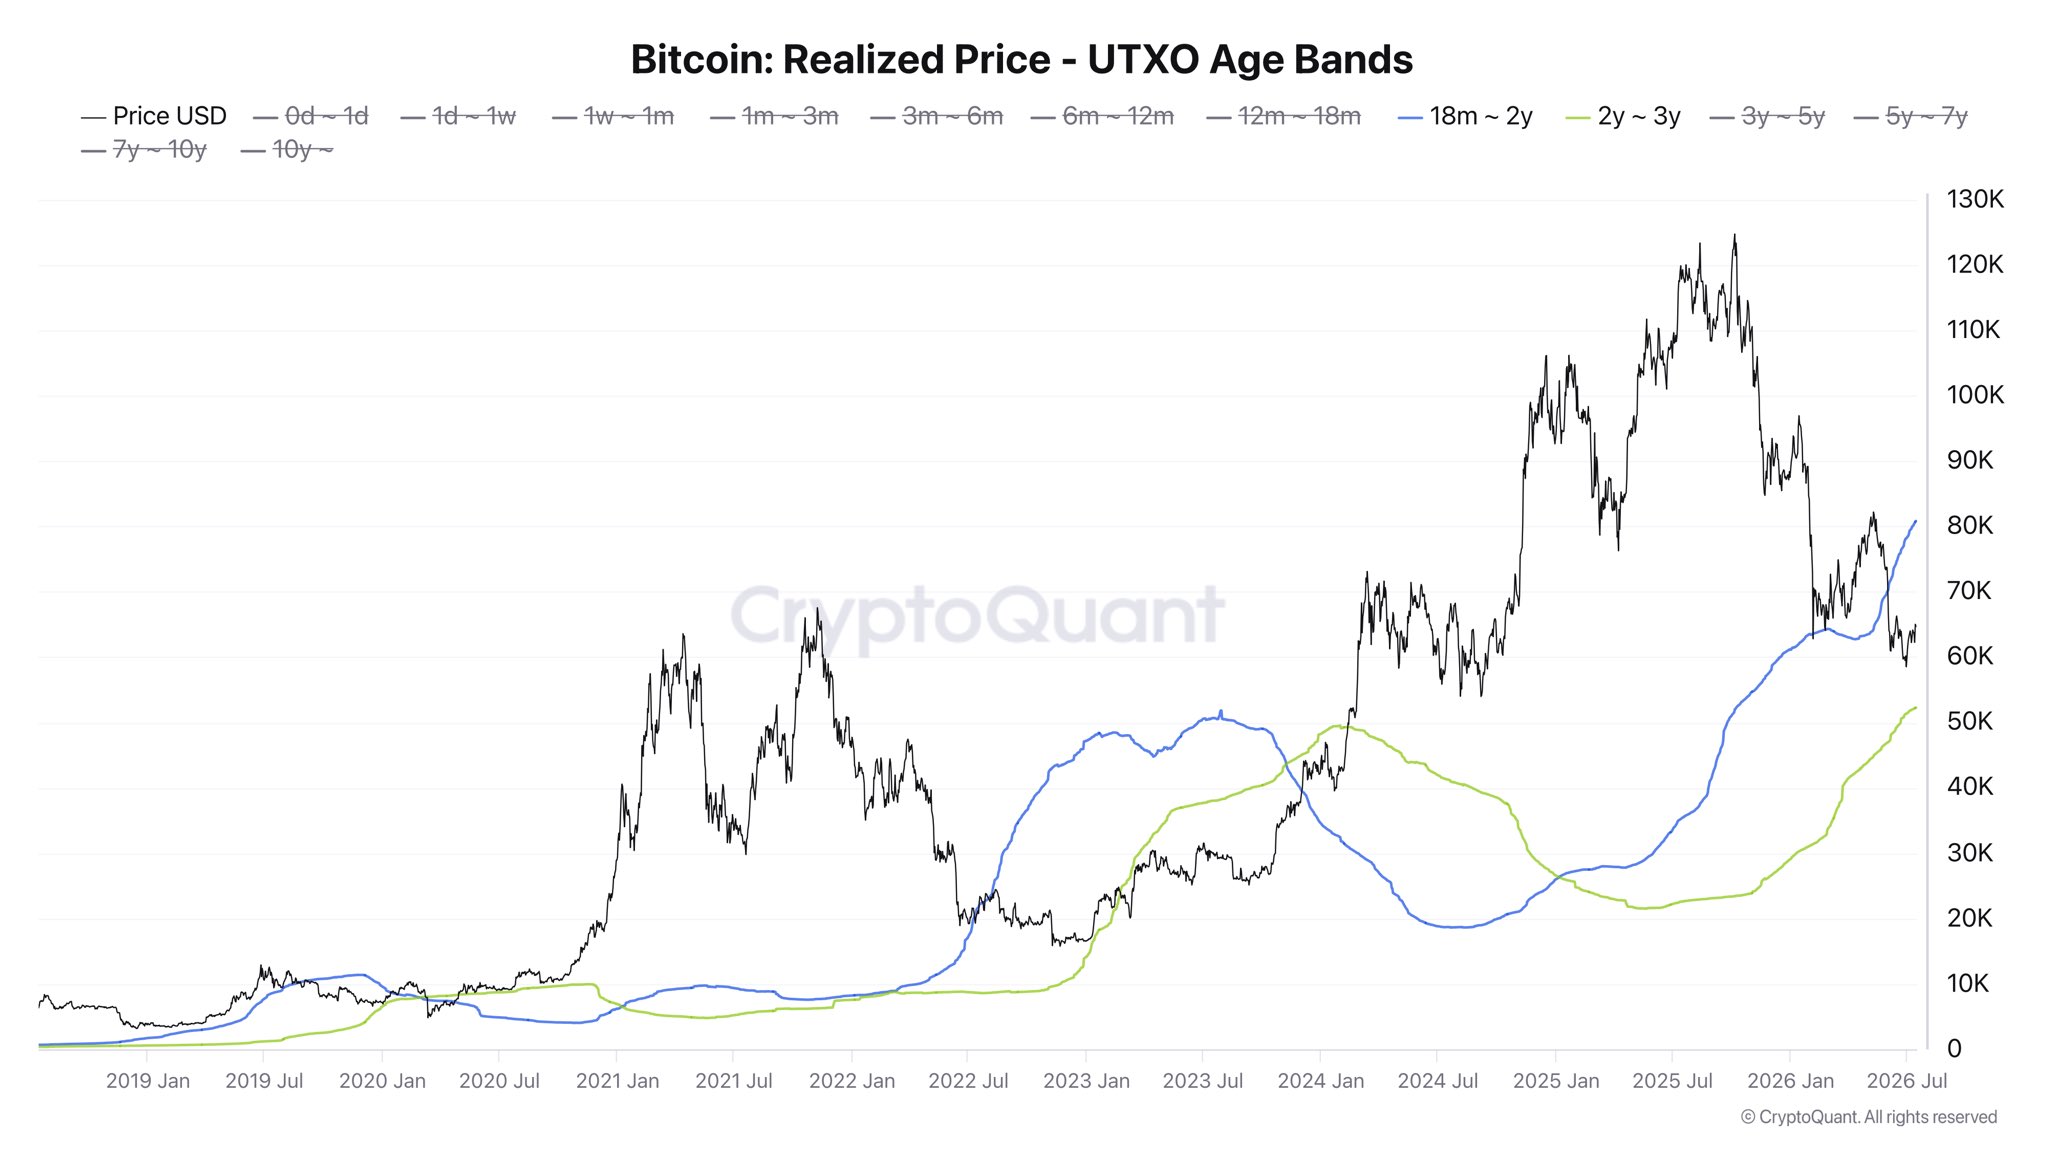
To understand the current stagnation, one must look at the on-chain data regarding investor cost bases. According to metrics from CryptoQuant and Glassnode, Bitcoin has been trading significantly below the realized price of several key investor cohorts. Specifically, the 18-month-to-two-year Unspent Transaction Output (UTXO) age band has become a critical focal point for analysts. This group represents investors who entered the market during the volatile periods of late 2022 and early 2023.
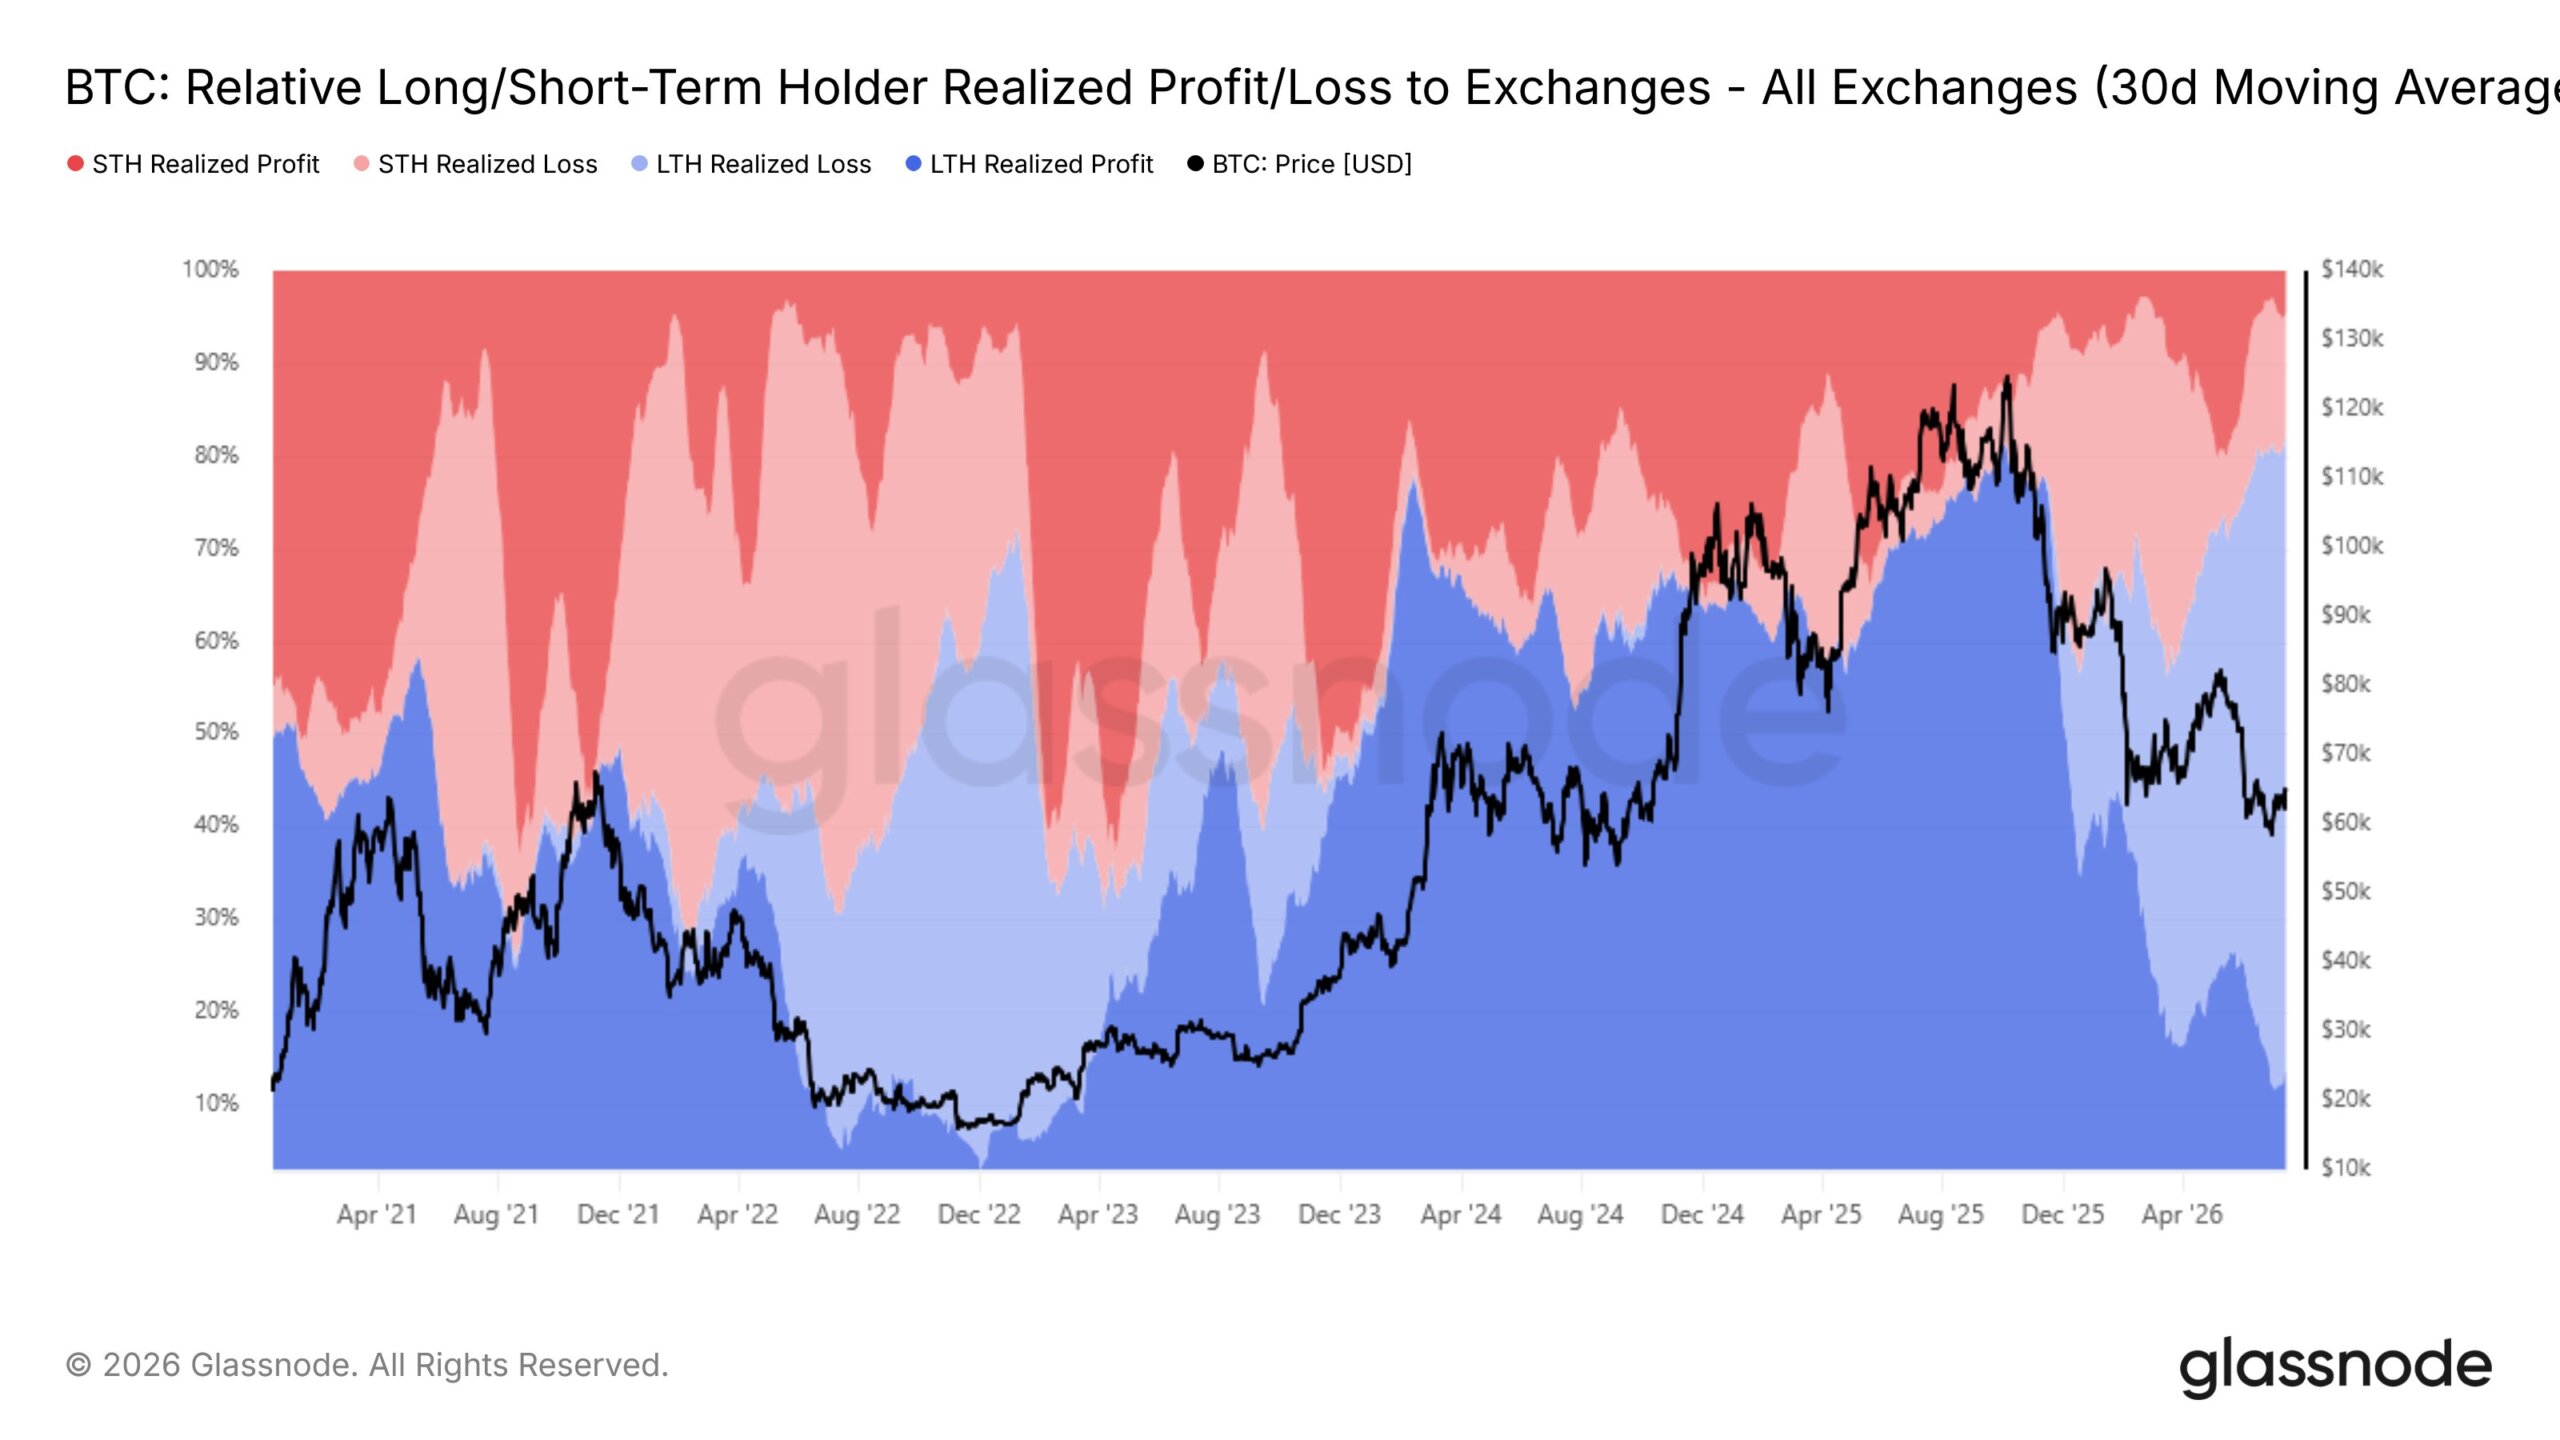
The realized price for this specific cohort—essentially the average price at which these coins last moved—currently sits at approximately $80,800. With the market price hovering in the low $60,000s, these investors are facing substantial unrealized losses. On-chain analysis indicates that as Bitcoin moved toward $65,000, many of these "underwater" holders chose to exit their positions to minimize further risk. Glassnode reports that more than 65% of current exchange inflows are attributable to long-term holders (LTHs) realizing losses. This behavior is historically consistent with late-stage bear market phases or prolonged consolidation periods, where the "smart money" or older hands dominate the sell side of the ledger.
Simultaneously, a different pressure is emerging from short-term holders (STHs). Those who were opportunistic enough to accumulate Bitcoin near the June lows of $58,000 saw the $65,000 spike as a 12% gain in a matter of days. Data suggests profit-taking from this group reached volumes comparable to the market’s peak in May. Consequently, Bitcoin is being squeezed from both ends: older holders are selling to cut losses, while newer buyers are selling to protect gains.
Institutional Resilience and the Role of Spot ETFs
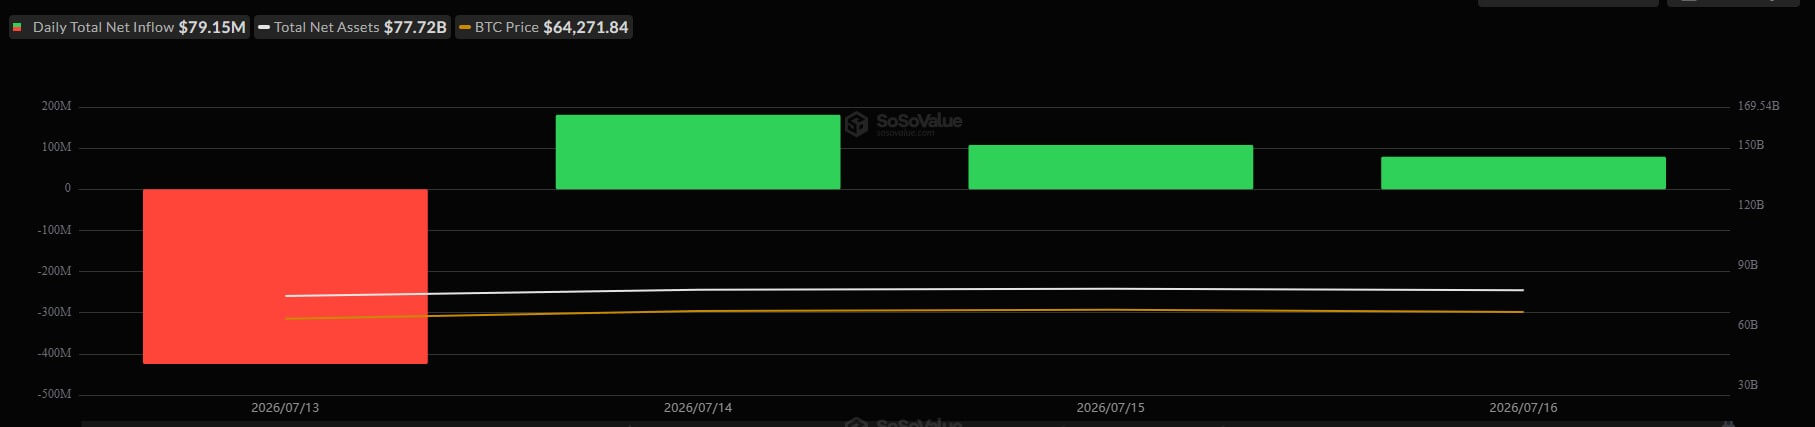
While the spot market grapples with holder exhaustion, the institutional sector via U.S.-listed spot Bitcoin exchange-traded funds (ETFs) has shown signs of a cautious turnaround. After a bruising Monday that saw over $424 million in net outflows, the tide shifted mid-week. On Tuesday, ETFs recorded $181.1 million in net inflows, followed by $107.7 million on Wednesday and an additional $79 million on Thursday.
Despite this three-day winning streak, which recovered nearly 87% of Monday’s losses, the broader trend remains tepid. The "Big Two" funds—BlackRock’s iShares Bitcoin Trust (IBIT) and Fidelity’s Wise Origin Bitcoin Fund (FBTC)—have averaged more than 1,250 BTC in net daily outflows over the past 30 days. Furthermore, overall trading volume for these instruments has been on a downward trajectory. This suggests that while some institutional capital is returning to "buy the dip," the aggressive, high-volume buying that characterized the first quarter of 2024 has transitioned into a more defensive, wait-and-see approach.
The Bitcoin Regime Score: A Bullish Signal in a Bearish Frame
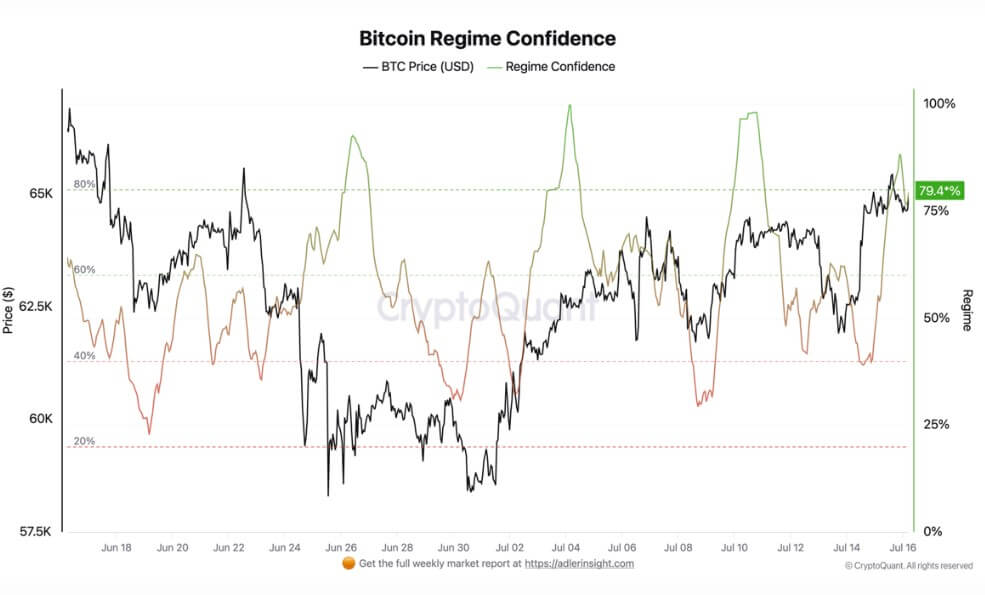
Despite the price retreat, some quantitative models suggest the underlying market structure is improving. The "Bitcoin Regime Score," an indicator developed by CryptoQuant analyst Axel Adler, has recently turned constructive. This model synthesizes various data points, including taker buy/sell flows, open interest pressure, funding rates, ETF activity, and exchange flows, to provide a comprehensive view of market health on a scale of -100 to +100.
On June 26, when Bitcoin was struggling near $58,300, the Regime Score plummeted to -42.9, indicating a deeply bearish environment. However, since early July, the indicator has spent the majority of its time in positive territory. As of the latest reading, the score stands at 34.7. Perhaps more importantly, the "Regime Confidence" metric—which measures the level of agreement among the model’s various sub-components—has climbed to 79.4%, just shy of the 80% high-confidence threshold.
The rise in these scores implies that the current recovery, while stalled in terms of price, is being supported by a healthier mix of market inputs than the rallies seen in May. For the recovery to regain its legs, analysts believe the Regime Score needs to break above the 50 level with high confidence, which would signal that demand is finally beginning to outpace the structural selling pressure from long-term holders.
The Options Market and the $70,000 Corridor
Looking ahead, the path to $70,000 is blocked not just by on-chain sellers, but by a massive concentration of positioning in the derivatives market. Data from Deribit, the world’s largest crypto options exchange, reveals a "corridor of resistance" spanning from $70,000 to $80,000.
The open interest (OI) stats are formidable:
- $70,000 Strike: $1.6 billion in Call OI
- $72,000 Strike: $1.0 billion in Call OI
- $75,000 Strike: $686 million in Call OI
- $80,000 Strike: $1.2 billion in Call OI
In total, nearly $4.5 billion in potential sell-side pressure or hedging activity is concentrated in this zone. As Bitcoin approaches these strikes, market makers who have sold these calls may need to hedge their delta by selling Bitcoin futures or spot, a process that can create a "gamma wall" that dampens upward volatility. This options concentration overlaps almost perfectly with the short-term holder cost basis near $69,000. For Bitcoin to clear this hurdle, it would likely require a significant external catalyst—such as a definitive shift in Federal Reserve policy or a major corporate adoption announcement—to generate the "god candle" necessary to blow through these layers of resistance.
Macroeconomic Context and Future Outlook
The broader economic landscape continues to provide a mixed backdrop for the cryptocurrency market. While the recent Consumer Price Index (CPI) report suggested that inflation is cooling, the Federal Reserve has remained hawkish in its rhetoric, maintaining that it needs "more evidence" before committing to interest rate cuts. This uncertainty has kept the U.S. Dollar Index (DXY) relatively stable, preventing the kind of dollar weakness that usually fuels a Bitcoin breakout.
If Bitcoin fails to hold the $60,000 support level during this period of consolidation, the downside risks are well-defined. Put option open interest is heavily concentrated at the $60,000 and $50,000 levels, with roughly $1.84 billion combined at those strikes. A breakdown below $60,000 could trigger a cascade of liquidations, as that level has functioned as a psychological "line in the sand" for bulls throughout the summer.
Conversely, there are early indications that the selling pressure from long-term holders may be reaching a point of exhaustion. The 30-day average of realized-loss volume for the LTH cohort has begun to trend downward. Historically, once this measure peaks and enters a sustained decline, it signals that the most motivated sellers have left the market, paving the way for a more organic price discovery process.
In summary, Bitcoin is currently caught in a transition phase. The "easy money" of the post-ETF approval rally has been made, and the market is now engaged in a grueling process of re-distributing supply from weary long-term holders to a new class of institutional and retail buyers. While the technical and on-chain indicators show signs of a bottoming process, the sheer volume of overhead resistance suggests that the journey back to $70,000 and beyond will be a battle of attrition rather than a swift sprint. Investors are now watching the $60,000 support and the $69,000 resistance levels as the primary boundaries for the next major trend.