Nila Kartika Wati
Bitcoin (BTC) has recently encountered significant headwinds in its attempts to establish the $80,000 psychological mark as a stable support level, yet market analysts warn that the true test of bullish momentum lies ahead, according to new research. This critical juncture is not merely a psychological barrier but a complex confluence of on-chain liquidity structures and technical indicators, painting a challenging picture for a sustained upward trajectory in the immediate future.
Glassnode Pinpoints Critical Overhead Liquidity Structures
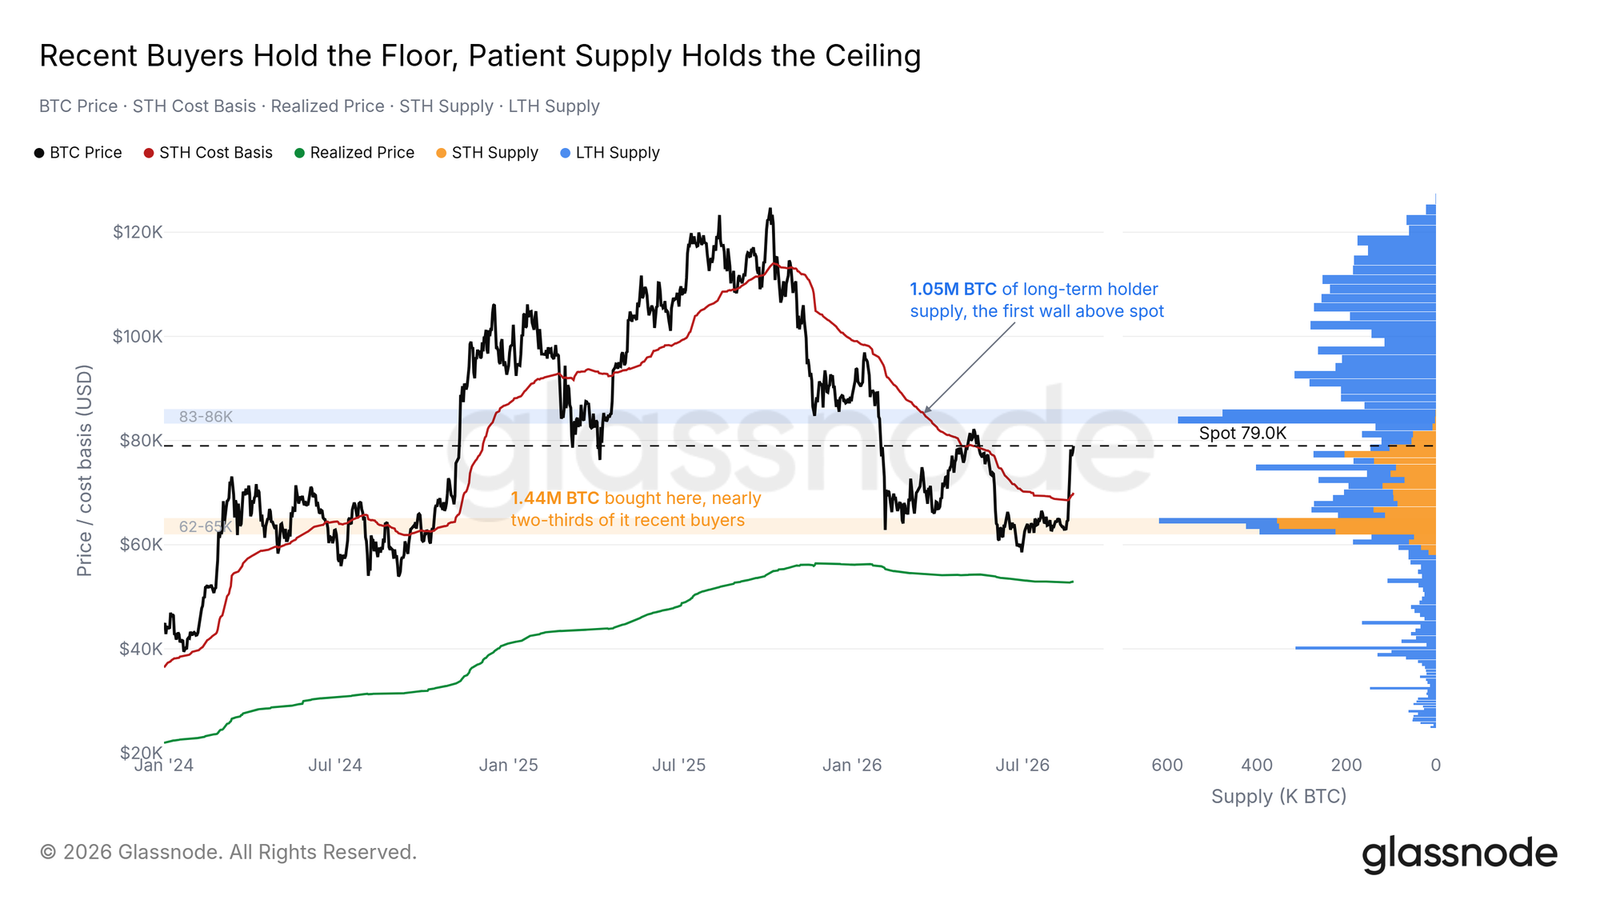
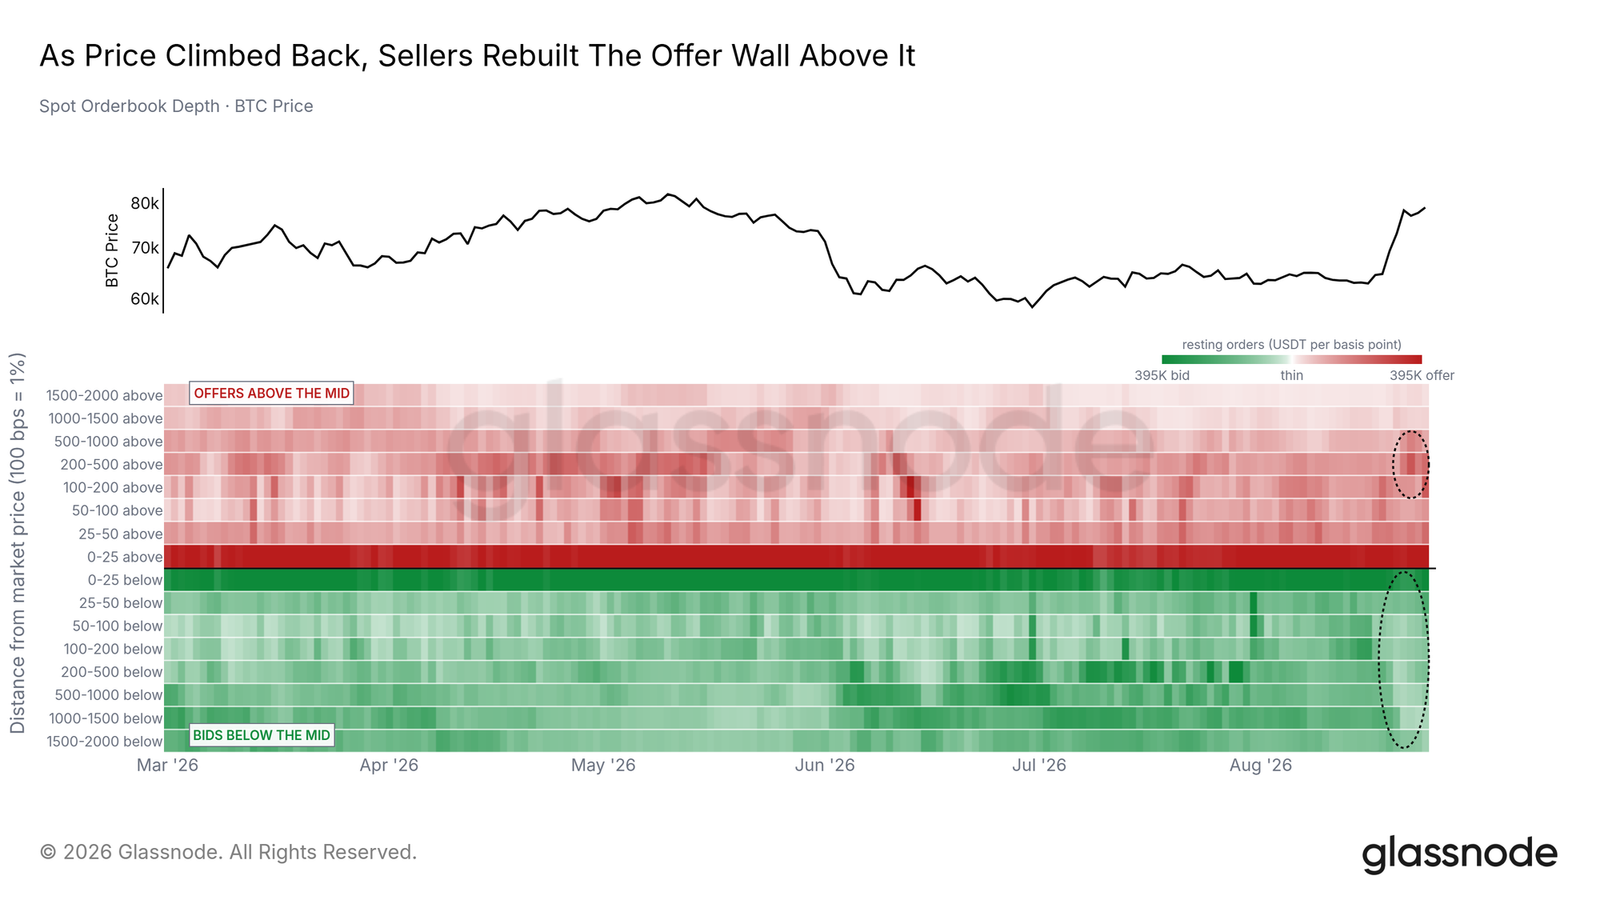
In its latest insightful analysis, "The Week Onchain" (Week 34, 2026), leading crypto analytics firm Glassnode has identified multiple significant pools of sell-side pressure, or "overhead liquidity structures," poised to enter the market should Bitcoin’s price continue to climb. These structures are concentrated within the $81,000 to $86,000 range, representing a formidable barrier that could test the resilience of the current market rally. The report meticulously details various components contributing to this overhead supply, indicating a highly contested zone for bulls.
Of particular interest within Glassnode’s findings are the behaviors and positions of Long-Term Holders (LTHs). LTHs are defined as wallets that have held BTC without selling for at least six months, often seen as conviction holders who are less likely to capitulate during market downturns. Glassnode’s research suggests that a substantial portion of this critical overhead supply between $83,000 and $86,000 originates from these very LTHs. These are investors who have weathered significant market volatility and drawn-downs, holding onto their assets. The report posits that a breach of the $83,000 mark would directly "test the resolve" of this LTH cohort, challenging their long-held positions and potentially incentivizing them to sell at or near their breakeven points, thereby adding considerable sell pressure to the market. This dynamic highlights a crucial psychological battleground, where the conviction of seasoned investors will be put to the ultimate test.
The implications of LTHs potentially offloading their holdings are profound. Historically, LTHs selling at breakeven after enduring a drawdown can signal a temporary exhaustion of buying power or a re-evaluation of market conditions. Their decision to hold through declines but sell on recovery indicates a cautious approach, potentially limiting upside momentum as new demand is absorbed by this existing supply.
A Multi-Layered Resistance Zone: Decoding Glassnode’s Insights

Beyond LTH activity, Glassnode’s analysis reveals a multi-faceted resistance architecture within the $81,000-$86,000 band. This zone is characterized by several distinct, yet converging, market dynamics:
- Self-Custody Cost-Basis Shelf at $80.8K: This refers to a significant aggregate cost basis for BTC held in self-custody wallets, indicating that many investors who acquired Bitcoin and moved it off exchanges would begin to reach profitability around this price point. A move above this level could trigger profit-taking.
- Dealer Gamma Flips Negative at $82.3K: In options markets, "gamma" refers to the rate of change of an option’s delta, indicating how sensitive an option’s price is to changes in the underlying asset’s price. When dealer gamma flips negative, it implies that market makers, who typically hedge their options positions, would need to sell the underlying asset (Bitcoin) as its price rises to maintain a delta-neutral position. This creates an automatic sell-side pressure that can accelerate price declines or cap rallies. The $82.3K level, therefore, represents a threshold where hedging activities by derivatives market participants could actively suppress upward movement.
- Surviving Liquidation Shelf to $86K: This refers to clusters of leveraged long positions that would face liquidation if the price were to reach certain levels. While liquidations typically occur on price drops, the "surviving liquidation shelf" refers to a zone where short positions (bets against Bitcoin) might get liquidated, leading to upward pressure. However, in this context, Glassnode might be referring to the overall structure of open interest that creates volatility or a point beyond which a cascading effect (either up or down depending on the initial trigger) could occur. More likely, it points to significant open interest in derivatives that would be impacted, contributing to potential market instability or a magnet for price.
- Patient-Supply Wall Fills $83K-86K: This reiterates the presence of the LTHs and other patient investors who have held their supply and are now looking for an opportunity to exit at favorable prices, having endured previous market downturns. This "wall" signifies a substantial volume of BTC waiting to be sold.
Glassnode succinctly concludes: "Every overhead structure we track now sits between $81K and $86K; that band is where the recovery’s demand meets its test." This statement underscores the critical nature of this price corridor, asserting that the current upward momentum, or "recovery demand," will face its most significant challenge in overcoming this concentrated resistance.
The Convergence of Technical Trend Lines
Adding another layer of complexity to Bitcoin’s current market structure is the convergence of multiple significant technical trend lines around the $80,000 price point. These technical indicators, widely observed by traders and analysts, reinforce the notion of a robust resistance hurdle.
According to data from TradingView, Bitcoin’s 50-week Exponential Moving Average (EMA) is currently positioned at approximately $77,353, while its 100-week EMA sits at around $78,485. Exponential Moving Averages are crucial technical analysis tools that provide a smoothed average of price data over a specific period, with more weight given to recent prices. They are commonly used to identify trend direction and potential support or resistance levels. The proximity of these two long-term EMAs just below the $80,000 mark suggests that if Bitcoin were to break above $80,000, these averages could quickly flip from potential resistance to crucial support, but their current position indicates an immediate challenge.
Further reinforcing this resistance zone is Bitcoin’s 365-day Volume-Weighted Average Price (VWAP), which is approximately $82,600. The VWAP is a sophisticated moving average that not only considers the closing price over a period but also factors in the trading volume at each price point. This makes it a more robust indicator of the true average price at which a significant amount of trading activity has occurred. A price level above the VWAP typically indicates that buyers are in control, while a price below suggests sellers dominate. The 365-day VWAP at $82,600 aligns directly with Glassnode’s identified resistance band, suggesting that the average investor who traded Bitcoin over the past year would be at or near breakeven around this price, contributing to potential sell-side pressure.
The alignment of these EMAs and the VWAP with Glassnode’s on-chain data creates a compelling picture of a deeply entrenched resistance zone. This confluence of technical and on-chain metrics amplifies the significance of the $81,000-$86,000 corridor, making it a pivotal battleground for Bitcoin’s short-to-medium term price action.
Recent Market Context and Broader Implications
The current struggle around $80,000 comes after a period of rapid price appreciation for Bitcoin. Following a significant dip earlier in the year, Bitcoin experienced a robust rebound, fueled by a combination of factors including growing institutional interest, the approval of spot Bitcoin ETFs in major jurisdictions, and a generally more optimistic macroeconomic outlook. This swift recovery, however, was met with skepticism from various market participants, who questioned its sustainability and whether it could endure without significant pullbacks.
Prominent trader and analyst Rekt Capital previously highlighted the importance of Bitcoin holding its 50-week EMA for an extended period before a meaningful trend change from a bear market could be definitively declared. This cautious stance aligns with historical patterns, where sustained consolidation above key moving averages is often a prerequisite for a durable bullish trend. The current positioning of the 50-week EMA just below $80,000 makes this level even more critical for validating any potential long-term trend reversal.
Moreover, the original article referenced expectations of "bear market timing due to continue until the end of 2026." While the exact methodology for this timing is not detailed, it implies a broader market sentiment that despite recent gains, Bitcoin may still be operating within a longer-term bearish cycle or consolidation phase, making any breakout attempts particularly challenging. This longer-term perspective adds weight to the current resistance, suggesting that overcoming it would require more than just transient buying enthusiasm.
Potential Scenarios and Market Reactions
The implications of Bitcoin’s interaction with the $81,000-$86,000 resistance band are significant for the broader cryptocurrency market.
- Bullish Scenario: A decisive breakthrough and sustained hold above the $86,000 mark would be a profoundly bullish signal. It would indicate that demand is strong enough to absorb the significant overhead supply from LTHs, overcome derivatives market hedging pressures, and invalidate key technical resistance levels. Such a move could potentially open the door for Bitcoin to target higher price discovery, potentially leading to renewed market euphoria and attracting fresh capital into the ecosystem. Market observers suggest that a clear break could trigger a short squeeze as bearish positions are forced to close, further propelling the price upward.
- Bearish Scenario: Conversely, a sustained rejection from this resistance zone, particularly if accompanied by increasing selling volume, could lead to a significant price pullback. This would confirm the strength of the overhead supply and the "test" failing, potentially pushing Bitcoin back to retest lower support levels. Initial targets for such a correction might include the previously mentioned EMAs, or even further down towards the $70,000-$75,000 range, which has shown some historical significance. A failed breakout could lead to increased market caution, deterring new investment and potentially exacerbating selling pressure from disheartened holders.
The psychological impact of round numbers like $80,000 also plays a role. While not a fundamental indicator, round numbers often act as natural magnet points for traders, influencing order placement and contributing to herd mentality. The struggle to flip $80,000 into support, therefore, has both technical and psychological dimensions.
Broader Economic and Geopolitical Context
Beyond the immediate on-chain and technical factors, Bitcoin’s price trajectory is also influenced by the wider macroeconomic landscape. Global liquidity conditions, inflation data, interest rate expectations from central banks, and geopolitical stability all play a role in shaping investor sentiment towards risk assets like cryptocurrencies. The original article, through a related link, briefly mentioned "higher US PCE data," which refers to the Personal Consumption Expenditures price index, a key inflation gauge for the Federal Reserve. Higher-than-expected inflation data can lead to expectations of tighter monetary policy, which typically creates a less favorable environment for speculative assets. Conversely, signs of easing inflation or a more dovish stance from central banks could provide tailwinds for Bitcoin.
As such, market participants are not only watching the charts and on-chain data but also closely monitoring global economic indicators and central bank pronouncements. The interplay between these macro forces and Bitcoin’s internal market dynamics will ultimately determine whether the current demand can overcome the formidable resistance arrayed against it.
In conclusion, Bitcoin stands at a critical juncture. The convergence of Glassnode’s granular on-chain analysis, highlighting significant LTH supply and complex derivatives structures, with established technical indicators like EMAs and VWAP, paints a clear picture of a robust resistance zone between $81,000 and $86,000. The coming days and weeks will be pivotal in determining whether Bitcoin bulls can muster the strength to conquer this multi-layered obstacle, or if the market will retreat, confirming the enduring challenges that lie ahead for the leading cryptocurrency.
This article is produced in accordance with Cointelegraph’s Editorial Policy and is intended for informational purposes only. It does not constitute investment advice or recommendations. All investments and trades carry risk; readers are encouraged to conduct independent research.