James Watt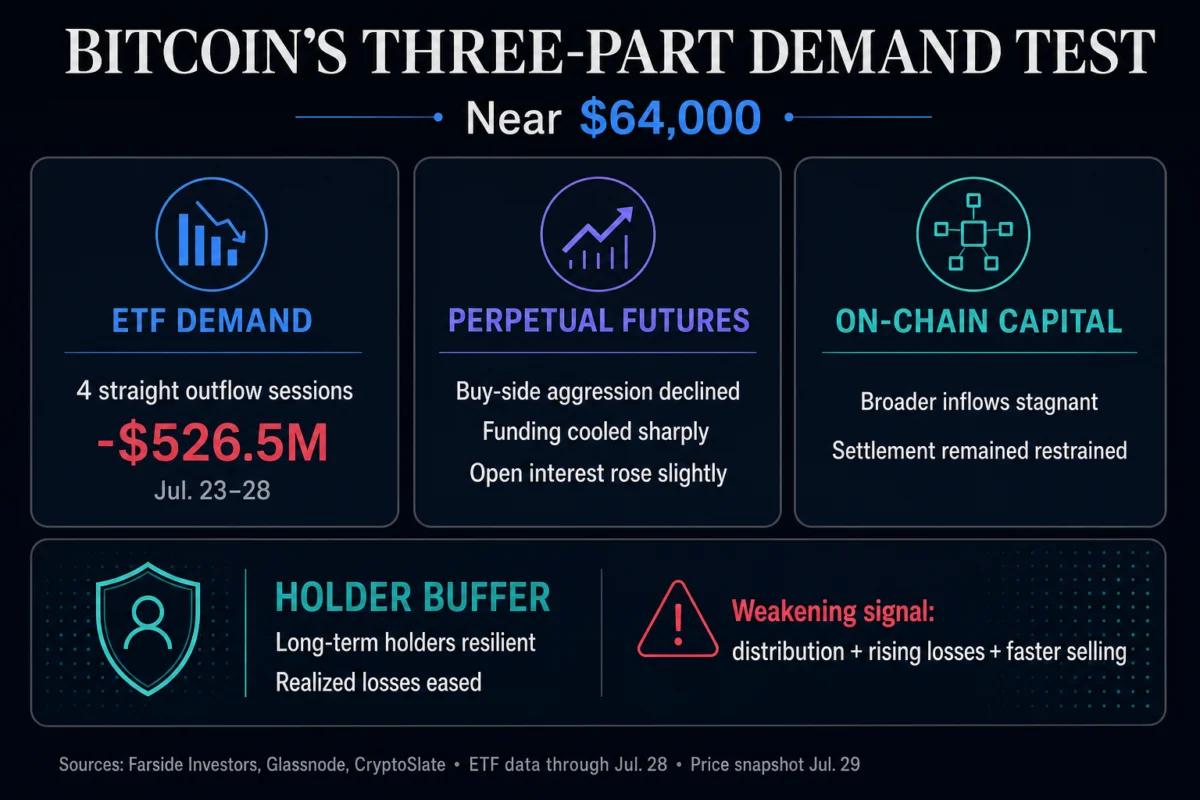
Bitcoin entered the trading session on July 29, 2026, facing a significant convergence of cooling demand across three primary market channels, placing the burden of price stability squarely on the shoulders of long-term conviction holders. As the digital asset hovered near the $64,200 mark, market analysts observed a simultaneous retreat in institutional spot ETF inflows, a softening of perpetual futures buying aggression, and a period of stagnant on-chain capital movement. This triple-threat to the asset’s immediate momentum has transformed the $64,000 level from a psychological floor into a critical technical test that will likely define the market’s trajectory for the remainder of the quarter.
The primary catalyst for the current caution is a notable reversal in the trend of US spot Bitcoin ETFs, which had previously served as a reliable engine for price appreciation. Data from Farside Investors reveals that over four consecutive trading sessions leading up to July 29, these regulated investment vehicles recorded a combined net outflow of $526.5 million. This reversal marks a sharp departure from the buying streaks seen earlier in the month and suggests that institutional appetite may be reaching a temporary saturation point or is reacting to broader macroeconomic uncertainty.
The Institutional Retreat: Analyzing ETF Outflow Data
The breakdown of recent ETF performance highlights a steady erosion of capital. On July 23, the market witnessed a substantial outflow of $225.1 million. This was followed by an even larger exit of $240.1 million on July 24. While the pace of outflows moderated at the start of the following week—with $11.6 million leaving on July 27 and $49.7 million on July 28—the cumulative effect has been a significant reduction in the buy-side pressure that typically supports the $65,000 to $67,000 range.
It is important to note that these figures represent net flows and do not necessarily indicate a wholesale abandonment of Bitcoin by institutional players. As previously observed by market commentators, finalized flow data often reflects positioning established at various points during a trading session rather than a single reactionary sell-off. For instance, BlackRock’s IBIT, which has historically dominated the ETF landscape, accounted for a significant portion of the initial reversal following a robust seven-day buying streak. This suggests that some institutional participants may be taking profits or rebalancing portfolios ahead of upcoming economic data releases.
Softening Derivatives and the Rise of Cautious Leverage
Parallel to the cooling ETF market, the derivatives sector is showing signs of increased hesitation. According to Glassnode’s Week 31 market pulse, Bitcoin’s recent retreat from a local high of approximately $66,700 toward the $64,000 level was accompanied by a marked decline in perpetual-futures buy-side aggression. While aggregate open interest—the total number of outstanding derivative contracts—saw a slight increase, the funding payments for long positions cooled sharply.

In the context of crypto-asset markets, cooling funding rates typically indicate that traders are becoming less willing to pay a premium to maintain leveraged long positions. This shift points to a transition toward "cautious leverage." Traders are not necessarily exiting the market entirely, but they are reducing their exposure to immediate downside risks. This sentiment is further corroborated by options market data. Analysis shows that there are currently approximately 52 open put contracts for every 100 call contracts. While this is a decrease from the 76 puts per 100 calls recorded in late June—suggesting a reduction in immediate hedging—the premium for one-week downside protection remains elevated compared to calls. This indicates that while traders are carrying less "insurance" than they were a month ago, they remain wary of a sudden break below the current support levels.
On-Chain Stagnation and Capital Inflow Constraints
The third pillar of the current demand stall is found in the lack of fresh on-chain capital. Despite Bitcoin’s prominence, the fundamental metrics that track network health—such as active addresses and economic settlement volume—have remained largely stagnant. Glassnode’s findings suggest that while the number of active addresses is holding steady, the actual volume of transactions and the pressure of economic settlement are restrained.
This lack of "new blood" in the ecosystem means that there is little organic demand to offset the selling pressure from ETFs or the de-leveraging in the futures market. Broader capital inflows, which typically signal the start of a new expansionary phase, have hit a plateau. Furthermore, regulated investment products across the globe have shifted into a net outflow posture, coinciding with a general decline in weekly trading volumes. This environment creates a vacuum where price movements are dictated more by the exhaustion of sellers than by the enthusiasm of new buyers.
Long-Term Holders: The Final Buffer Against Depreciation
With institutional, derivative, and on-chain demand drivers all stalling simultaneously, the market’s stability now relies almost exclusively on the conviction of long-term holders (LTHs). These are entities that have held their Bitcoin for at least 155 days and are historically less likely to sell during periods of high volatility.
Glassnode’s analysis indicates that this cohort continues to show remarkable resilience. Even as the price tests the $64,000 threshold, aggregate unrealized losses among long-term holders have declined modestly, and realized losses have eased. This suggests that the "HODL" mentality remains the dominant force preventing a deeper correction. As long as these holders refrain from distributing their coins into the market, they create a supply floor that can withstand temporary lapses in demand.
However, the "holder-buffer thesis" is not infallible. Analysts warn that the current support structure would begin to erode if a sustained break below the $64,000 range were accompanied by a shift in long-term holder behavior. If this group begins to show signs of renewed distribution or if realized losses start to accelerate, it would signal that even the most committed participants are losing confidence. At present, a brief move below $64,000 is viewed by many as a "liquidity grab" or a deep price test rather than a fundamental breakdown, provided the long-term holder data remains stable.

Macroeconomic Context and Market Sentiment
The current stall in Bitcoin demand cannot be viewed in isolation from the broader financial landscape. The market is currently navigating a period of significant uncertainty regarding central bank policies, specifically the Federal Reserve’s upcoming interest rate decisions. A separate analysis of Bitcoin options traders revealed that many are dropping hedges ahead of what is being described as the "most uncertain Fed meeting" in recent months.
The global market cap for cryptocurrencies currently sits at approximately $2.17 trillion, with Bitcoin maintaining a dominant 58.67% share. With a 24-hour trading volume of $28.11 billion—an 8.34% increase—it is clear that while demand is stalling, activity is not disappearing. Instead, the market is undergoing a period of consolidation and re-evaluation. The $1.27 trillion market cap of Bitcoin remains a formidable valuation, but the lack of immediate catalysts for upward movement has left the asset in a state of equilibrium.
Chronology of Recent Market Events
To understand the current state of the market, it is necessary to review the timeline of the past week:
- July 23-24: Large-scale ETF outflows totaling nearly $465 million signal a shift in institutional sentiment as Bitcoin fails to maintain levels above $66,000.
- July 25-26: The market enters a weekend lull, with price action stabilizing near $65,000, though underlying on-chain metrics show no signs of recovery.
- July 27: Trading resumes with a modest $11.6 million ETF outflow. Glassnode releases its Week 31 pulse, highlighting the softening in perpetual futures and the rise of cautious leverage.
- July 28: Bitcoin tests the $64,000 support level more aggressively. Options data confirms a reduction in hedging, even as the price remains under pressure.
- July 29: Bitcoin trades near $64,200. The market identifies the $64,000 mark as the immediate line in the sand, with long-term holders identified as the primary support mechanism.
Implications for the Near-Term Outlook
The convergence of these factors suggests that Bitcoin is in a "wait-and-see" phase. The immediate risk is a technical breakdown if $64,000 fails to hold, which could trigger a cascade of liquidations among the remaining leveraged longs. Conversely, if long-term holders continue to absorb whatever selling pressure emerges from the ETF and futures markets, the current consolidation could form the base for a renewed push toward the $70,000 level later in the year.
The lack of fresh capital inflow is perhaps the most concerning metric for those looking for a rapid recovery. Without a significant increase in active addresses or a return to positive net flows in the ETF sector, Bitcoin may remain range-bound. Investors are closely watching for any signs of a "dovish" pivot from the Federal Reserve or an improvement in global liquidity conditions, both of which have historically acted as catalysts for Bitcoin demand.
In conclusion, the Bitcoin market at the end of July 2026 is characterized by a transition from speculative and institutional-led momentum to a period of defensive holding. The $64,000 support level is more than just a number; it represents the boundary between a healthy consolidation and a potential trend reversal. As the three key demand drivers remain stalled, the conviction of the asset’s most loyal participants will be the ultimate arbiter of price stability.