The global cryptocurrency market is currently navigating a period of heightened uncertainty as Bitcoin (BTC) struggles to maintain its momentum following a recent climb to the $74,000 threshold. On Thursday, the digital asset traded approximately 4.5% below this peak, sparking a vigorous debate among institutional traders and technical analysts regarding the sustainability of the current rally. While some market participants view the $74,000 level as a definitive "local top" that precedes a significant correction, others argue that the structural foundations of the 2024 market cycle are fundamentally different from previous years, particularly the 2022 bear market.
The tension in the market is characterized by a conflict between historical fractal analysis and modern fundamental shifts. Bitcoin’s recent recovery from the $60,000 support zone was initially met with optimism, yet the subsequent rejection at higher price levels has led to a re-evaluation of the asset’s short-term trajectory. As the market processes these developments, the focus has shifted toward specific technical indicators, liquidity zones, and the historical timing of market peaks.
The 150-Day Cycle Hypothesis and Historical Precedents
One of the primary arguments for a potential downturn is rooted in the "150-day rule," a temporal observation shared by several prominent analysts. According to technical analyst Bitcoin Hyper, historical data from previous market cycles suggests that Bitcoin often establishes a local high approximately 140 to 150 days after reaching a major peak. The recent rise to $74,000 occurred precisely 149 days after the bull market peak of $126,000, which was recorded in late 2025.

In previous cycles, these 150-day markers have served as turning points where exhaustion sets in among buyers, leading to a period of consolidation or a deeper retracement. The psychological impact of these cycles cannot be understated; as the asset approaches these historical windows, sell-side pressure often increases as traders seek to "front-run" the expected correction. This cyclical behavior suggests that the market may be entering a cooling-off period where the initial euphoria of the recovery is replaced by caution.
Comparative Analysis: 2022 Bear Market vs. 2026 Price Action
The comparison to the 2022 cycle has become a central theme in current market discourse. Pseudonymous trader Bitcoin Isaiah has drawn direct parallels between the current price action and the events of 2022, when Bitcoin experienced a brief but intense "relief rally" to $48,200 before plunging 68% to a bottom of $15,500. Isaiah characterizes the recent move to $74,000 as a "perfect local top indicator," suggesting that the premature celebrations among bullish investors often serve as a contrarian signal for an impending "dump."
The core of this argument lies in market sentiment. In 2022, similar levels of retail euphoria were observed just before the market’s collapse. If history were to repeat itself in a fractal manner, some analysts warn that Bitcoin could not only lose its current support at $70,000 but could also revisit levels well below $60,000. This bearish outlook is supported by the emergence of "death cross" patterns on shorter timeframes and significant overhead resistance that has historically been difficult to flip into support without substantial volume.
Liquidity Traps and the Hunt for Market Orders
Beyond historical fractals, the mechanics of market liquidity provide another explanation for the recent price volatility. The "Master of Crypto" analysis suggests that the brief surge above $70,000 functioned as a "liquidity trap." In market terminology, a liquidity trap occurs when price action is manipulated or driven toward a specific level to trigger the stop-loss orders of both short-sellers and long-positioned traders.

By wiping out these positions, the market clears the path for a move toward zones where "bigger money" or institutional ask-orders are concentrated. Current order book data indicates a significant cluster of buy orders between the $62,000 and $65,000 range. If the price is indeed seeking liquidity, a descent into this zone would be a logical progression, allowing large-scale players to accumulate or exit positions with minimal slippage. This theory posits that the $74,000 peak was not a natural extension of the bull market but rather a calculated move to harvest liquidity before a more sustained move in the opposite direction.
The Counter-Argument: Structural Shifts and the 200-Week EMA
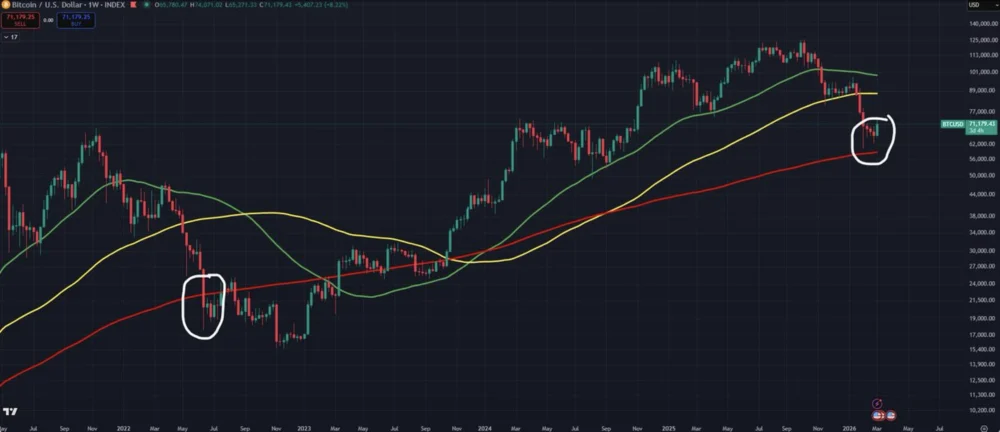
Despite the bearish comparisons, a significant segment of the analyst community maintains that the 2024–2026 cycle is fundamentally distinct from the 2022 experience. Analyst Bitcoin Munger argues that using the 2022 bear fractal as a basis for current bearishness is flawed because the underlying technical structure has changed.
A critical point of divergence is the relationship between the Bitcoin price and the 200-week exponential moving average (EMA). During the 2022 drawdown, Bitcoin’s price "cut through" the 200-week EMA with relative ease, signaling a deep and prolonged bear market. In contrast, the current cycle saw Bitcoin retest the 200-week EMA as a support level, followed by a robust bounce. This behavior suggests that the 200-week EMA is now acting as a solid floor rather than a ceiling, a characteristic typically associated with healthy bull markets rather than terminal cycles.
Furthermore, the formation of an "ascending triangle" on the daily charts provides a bullish technical setup. According to analyst Mister Crypto, if Bitcoin can maintain the $70,000 level as a support floor, the asset is poised for a "strong move to the upside." An ascending triangle is generally considered a continuation pattern, indicating that despite the temporary volatility, the primary trend remains upward.

The Role of Institutional Inflows and Spot ETFs
Perhaps the most significant difference between the current market and the 2022 cycle is the presence of institutional infrastructure. The introduction of Spot Bitcoin ETFs in the United States has fundamentally altered the supply-demand dynamics of the asset. Recent data highlights that Bitcoin ETFs recorded inflows of approximately $462 million in a single day during the surge toward $73,000.
This institutional participation provides a "sticky" layer of demand that did not exist during the 2022 crash. Unlike retail investors who may panic-sell during volatility, institutional funds often operate on longer time horizons and use algorithmic buying strategies that provide price support during dips. The tightening of the available supply on exchanges—evidenced by the recent "anomalous" outflow of 32,000 BTC from Bitfinex—further suggests that long-term holders are moving their assets into cold storage rather than preparing to sell.
Timeline of Recent Market Events
To understand the current conflict, it is essential to review the chronology of the past several months:
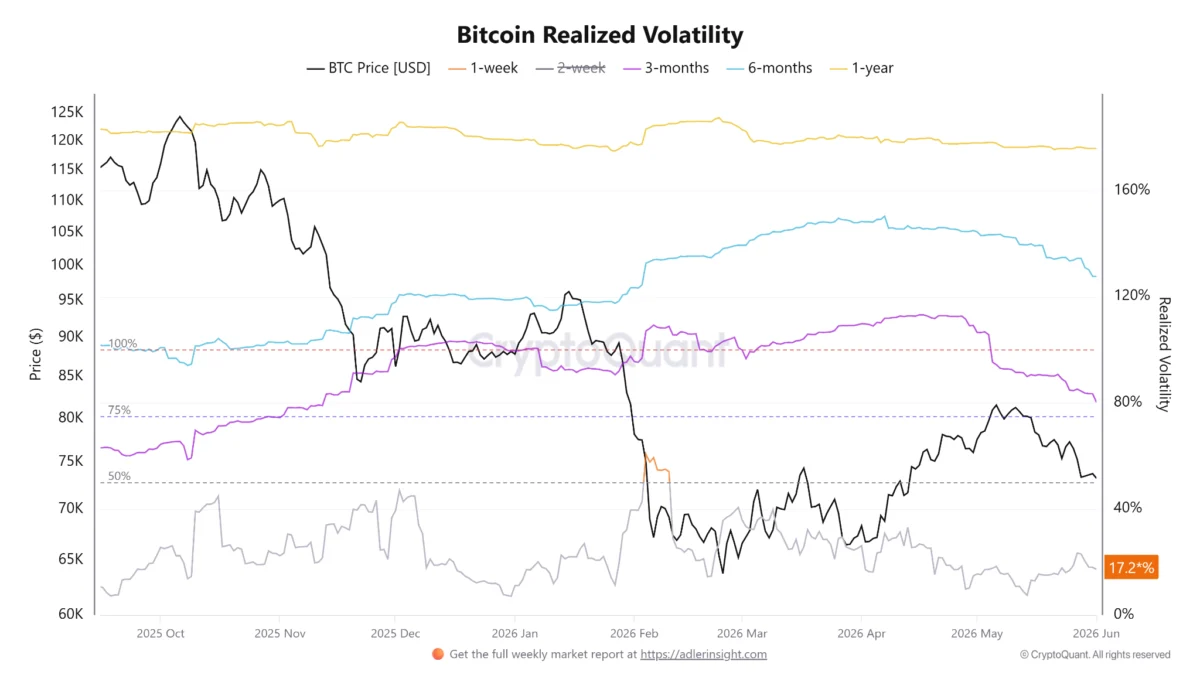
- October 2025: Bitcoin reaches a bull market peak of $126,000, driven by global adoption and favorable macroeconomic conditions.
- Early 2026: A period of cooling occurs as the market digests the gains, with Bitcoin eventually finding a temporary bottom around the $60,000 mark.
- Late February 2026: Signs of a "relief rally" emerge as institutional ETF inflows accelerate, pushing the price back toward the $70,000 psychological barrier.
- Thursday (Recent Peak): Bitcoin hits a local high of $74,000, exactly 149 days post-ATH, triggering the "150-day cycle" alerts among technical analysts.
- Current Status: The price experiences a 4.5% rejection, leading to a standoff between those predicting a sub-$60,000 crash and those targeting a breakout toward $80,000.
Broader Impact and Market Implications
The outcome of this technical struggle will have far-reaching implications for the broader cryptocurrency ecosystem. If the "local top" theory proves correct and Bitcoin undergoes a significant correction, it could lead to a period of "altcoin capitulation," where smaller digital assets lose even more value relative to BTC. Conversely, if Bitcoin holds the $70,000 level and completes its ascending triangle breakout, it could signal the start of a "parabolic phase" for the entire market.

From a macroeconomic perspective, Bitcoin’s performance continues to be influenced by global liquidity trends and the policies of the Federal Reserve. As institutional interest grows, Bitcoin is increasingly viewed as a barometer for global risk appetite. A sustained rally above $74,000 would likely confirm Bitcoin’s status as a maturing asset class capable of weathering cyclical downturns, while a repeat of the 2022 crash would suggest that the asset remains highly susceptible to the boom-and-bust cycles of its early years.
As of now, the market remains in a state of watchful waiting. The convergence of historical cycle timing, liquidity-seeking price action, and institutional support has created a complex environment where both bullish and bearish cases have merit. Traders are advised to monitor the $70,000 support level and the 200-week EMA closely, as these will likely determine the direction of the next major move in the Bitcoin market.
While the technical charts offer conflicting signals, the fundamental landscape—marked by ETF inflows and diminishing exchange supply—suggests that even if a local top has been reached, the long-term structural integrity of the Bitcoin market remains more robust than in previous cycles. Whether this resilience is enough to prevent a 2022-style crash remains the primary question for investors heading into the next quarter.