James Watt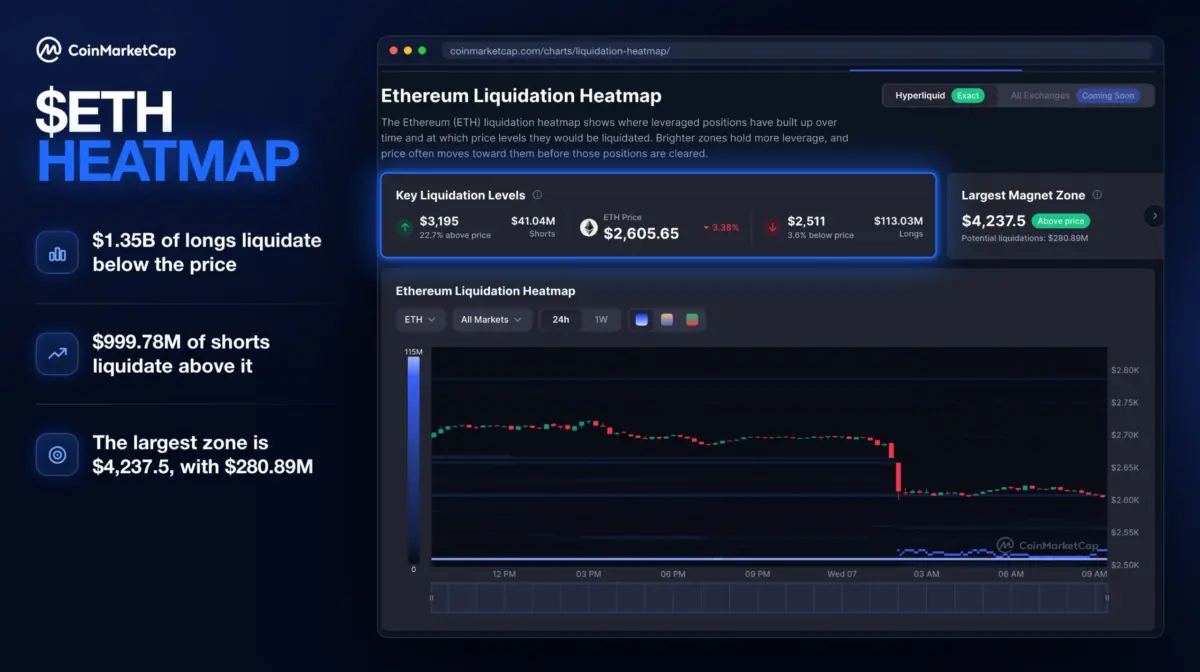
The Ethereum market is currently navigating a period of heightened volatility as the second-largest cryptocurrency by market capitalization retreats from its recent resistance levels. Following a 5.9% decline over a 24-hour period, Ethereum (ETH) has slipped to approximately $2,570, effectively breaking a consolidation range near $2,700 that had held for several days. This downward momentum has placed roughly $1.35 billion in leveraged long positions at an immediate risk of liquidation, according to the latest market data from CoinMarketCap and various on-chain analytics platforms. As the price moves closer to the psychological and technical support level of $2,500, the "liquidation heatmap" suggests that a significant portion of the market’s bullish bets could be forcibly closed, potentially accelerating the downward trend through a "long squeeze" mechanism.
The current market structure reveals a stark imbalance between optimistic and pessimistic positioning. While approximately $1.35 billion in ETH long exposure sits at various liquidation thresholds below the current price, short sellers face a comparatively lower risk, with roughly $999.78 million in short positions vulnerable to a price move upward. This discrepancy highlights a prevailing bullish sentiment among retail and institutional traders who have utilized high leverage to bet on a recovery, a strategy that is now being tested by a combination of institutional sell-offs and a cooling of demand for spot Ether exchange-traded funds (ETFs) in the United States.
Chronology of the Price Decline and Market Reaction
The descent toward the $2,500 mark did not occur in isolation. Over the past week, Ethereum had attempted to stabilize around the $2,700 region, supported by intermittent retail buying. However, this level faced persistent pressure from institutional distributions and a shifting macroeconomic outlook.
On October 6, the situation intensified when Ethereum broke below its short-term support. Within a 24-hour window, the price fell nearly 6%, triggering a wave of forced liquidations before the asset even reached its most significant liquidation clusters. Data from CoinGlass indicates that $233.36 million in Ethereum positions were liquidated during this period, with long traders bearing the brunt of the losses. Specifically, $221.87 million—or approximately 95% of the total liquidations—were long positions.
The velocity of the sell-off was particularly notable over a 12-hour stretch, during which $226.22 million was wiped out. The single largest liquidation event occurred on the Binance exchange, where a $26.64 million ETH/USDC position was forced closed. Such large-scale liquidations often act as a catalyst for further price drops, as the automatic selling of assets to cover margin requirements increases the supply on the market, driving prices down further and hitting the next set of liquidation triggers.
Detailed Analysis of Liquidation Thresholds and Exchange Data
The current "pressure point" for the market is centered around the $2,511 level. On the decentralized perpetual exchange Hyperliquid, approximately $112.83 million in ETH longs are positioned for liquidation at or near this price point. The proximity to this threshold has narrowed significantly; while traders enjoyed a 7.4% price cushion only 24 hours ago, that buffer has shrunk to approximately 3.6% as of the latest trading session.
A liquidation map provides a visualization of where leveraged trades become increasingly vulnerable. It is important to note that these figures represent a range of price levels rather than a single "cliff." However, as prices move through successive thresholds, the cumulative effect can create a "cascade." If Ethereum continues its decline toward $2,500, the market will face a critical test: whether the initial wave of liquidations has removed enough leverage to allow for a price floor, or whether the remaining $1.35 billion in long positions will create a secondary wave of selling.
Exchange-specific metrics further illustrate the persistence of bullish positioning despite the price retreat. On Binance, the long-to-short ratio among ETH/USDT accounts stands at 3.32, suggesting that for every one short position, there are more than three long positions. On OKX, the ratio is 2.13. Even among the largest traders on Binance, the skew remains toward the long side, with a 2.34 ratio by account and 1.62 when measured by position size. These metrics indicate that many traders are "buying the dip," betting that the $2,500 support will hold. However, this widespread bullishness also means that the market remains "top-heavy" with leverage, increasing the risk of a sharp correction if the support fails.
Shifting Sentiment and the Role of Funding Rates
While account ratios remain bullish, the derivatives market is showing signs of a shift in momentum through funding rates. Funding rates are periodic payments made between long and short traders to ensure that the price of perpetual futures contracts stays aligned with the spot price.

According to CoinGlass, Ethereum’s open-interest-weighted funding rate has turned negative, sitting at -0.0041%, while the volume-weighted rate is -0.0034%. Negative funding rates occur when the perpetual contract price is lower than the spot price, indicating a stronger demand for short exposure. In this scenario, short sellers pay long holders to maintain their positions. This shift suggests that a growing number of traders are now hedging their portfolios or actively betting on further declines, creating a crowded environment where both sides of the trade are heavily leveraged.
Institutional Headwinds: The ETF Outflow Factor
The technical weakness in Ethereum’s price action is being exacerbated by a significant cooling in institutional demand. US-based spot Ether ETFs, which were launched with high expectations in July, have recently seen a sharp reversal in capital flows.
On October 6, spot Ether ETFs recorded approximately $202 million in net outflows, marking the largest single-day withdrawal since mid-September. This movement extended a losing streak to six consecutive sessions, totaling roughly $408 million in withdrawals over that period. The acceleration of these outflows is a cause for concern among analysts; the $202 million withdrawn in a single day nearly matched the combined total of the previous five sessions.
Historically, Ethereum had shown resilience to ETF selling, holding the $2,700 range even as institutional investors trimmed their positions. However, that resilience appears to have buckled. Despite the recent retreat, it is important to maintain perspective: since their inception, these funds have accumulated a total of $13.55 billion in cumulative net inflows, according to SoSoValue. The current outflows represent a significant reversal, but they occur within a much larger pool of institutional capital that remains committed to the Ethereum ecosystem.
The critical question for the coming days is whether institutional investors will view the $2,500 price level as an attractive entry point or if the trend of redemptions will continue. A reversal back toward net inflows would signal that "smart money" sees the current dip as a buying opportunity, whereas continued outflows would suggest a broader de-risking phase among Wall Street participants.
Broader Market Implications and Technical Outlook
The struggle of Ethereum to maintain its valuation is also reflective of broader trends within the cryptocurrency market. Ethereum often tracks the movement of Bitcoin, which has also faced volatility amid changing expectations for Federal Reserve interest rate cuts and geopolitical tensions in the Middle East. When the market leader, Bitcoin, faces resistance, "altcoins" like Ethereum often experience amplified volatility.
From a technical analysis standpoint, the $2,500 level is not just a psychological round number; it has served as a pivotal zone in previous months. In August and September, this area acted as both a floor and a ceiling during various trading cycles. A decisive break below $2,500 could open the door for a retest of the $2,400 or even $2,200 levels, which would likely trigger the bulk of the $1.35 billion in liquidations mentioned earlier.
Conversely, if Ethereum can defend the $2,500 support and consolidate, it may form a "double bottom" or a base for a recovery back toward $2,700. For such a recovery to be sustainable, the market would likely need to see a stabilization of ETF flows and a reduction in the extreme leverage currently present in the derivatives market.
Conclusion
The Ethereum market is currently at a crossroads. The combination of $1.35 billion in at-risk leverage, negative funding rates, and record-setting ETF outflows has created a high-pressure environment for the asset. While the majority of traders on major exchanges like Binance and OKX remain positioned for an upside move, the reality of forced liquidations and institutional selling has placed the $2,500 support level under immense scrutiny.
In the short term, the market’s direction will likely be determined by whether the current price level can attract enough spot demand to offset the liquidation of leveraged longs. As the "cushion" for these positions continues to thin, the possibility of a volatile "flush-out" remains a primary concern for market participants. Investors and traders alike are now watching the $2,500 threshold, as its preservation or failure will likely dictate Ethereum’s price trajectory for the remainder of the month.