The cryptocurrency market is currently navigating a complex landscape, with Bitcoin (BTC) bulls struggling to maintain higher price levels despite pushing the asset above $68,300. This ongoing battle for upward momentum could see Bitcoin record its fifth consecutive monthly candle close in the red, a notable streak that, if confirmed in the coming days, would mark its longest losing run since the 2018/2019 bear market. During that period, Bitcoin endured six successive months of decline, a historical precedent that offers both a sobering reminder of market volatility and a glimmer of hope, as that extended downturn was famously followed by a significant recovery.
The current situation sees Bitcoin at a critical juncture, with market participants closely monitoring various technical and fundamental indicators for clues about its next major move. While the immediate sentiment appears cautious, certain long-term technical signals are flashing potential bullish reversals, suggesting that the current period of consolidation and decline might be a precursor to a substantial price surge. However, these optimistic technical readings are tempered by observable trends in institutional investment, particularly the recent outflows from US spot Bitcoin Exchange-Traded Funds (ETFs), which remain a crucial determinant of sustained market health.
Bitcoin’s Extended Downtrend and Historical Precedents

Bitcoin’s recent performance has been characterized by a persistent downward pressure that has prevented it from consolidating gains above key resistance levels. Should the current trend persist through the end of the month, the cryptocurrency will log its fifth consecutive month of losses. This marks a significant period of bearish sentiment, echoing a similar, albeit longer, six-month losing streak observed between 2018 and 2019. That earlier period of sustained decline saw Bitcoin’s price fall significantly before staging a remarkable comeback.
Specifically, data from CoinGlass highlights that the 2018/2019 losing streak ultimately paved the way for a robust recovery, with Bitcoin rallying an impressive 131.6% over the subsequent five months. This historical context provides a crucial backdrop for current market discussions. While past performance is not indicative of future results, the memory of such a powerful rebound following an extended bearish phase injects a degree of cautious optimism among long-term investors and analysts who view the current downturn as a potential accumulation opportunity. The 2018/2019 period was characterized by a broader market capitulation and a cleansing of speculative excess, which ultimately set the stage for healthier, more sustainable growth. Whether the current market conditions are analogous in their capacity to precede a similar recovery remains a subject of intense debate and analysis.
Technical Indicators Hint at an Impending Volatility Breakout
Despite the immediate bearish sentiment, several prominent technical indicators are suggesting that the market might be coiling for a significant price movement. One such indicator, the Bollinger Bands, is currently at its "tightest" level on record on the monthly chart, according to insights shared by crypto analyst Dorkchicken. Bollinger Bands are a technical analysis tool that measures market volatility and identifies potential overbought or oversold conditions. When the bands contract or become "tight," it typically signals a period of low volatility, which historically precedes an explosive price move in either direction.

The historical track record of such tight Bollinger Bands on Bitcoin’s monthly chart has overwhelmingly pointed towards bullish breakouts. Previous instances where the bands compressed to similar levels have generally been followed by substantial upward price movements. The notable exception to this pattern occurred in 2022, which saw a breakdown from $20,000 to $16,000. This particular downturn, however, was heavily influenced by major exogenous factors such as the collapse of Terra-Luna and the FTX exchange, which created unique market conditions that overshadowed typical technical signals. Excluding such black swan events, the tightening of Bollinger Bands often serves as a powerful signal for an impending surge in volatility, frequently to the upside.
The convergence of Bitcoin’s prolonged losing streak, which aligns with a historical pattern that preceded a major rally, and the unprecedented tightening of the monthly Bollinger Bands, presents a compelling narrative for a potential turnaround. These technical signals suggest that the market is building pressure, and a decisive move could be on the horizon.
The Pivotal Role of Institutional Investment: Bitcoin ETF Flows
While technical indicators offer a glimpse into potential future price action, the immediate health and direction of the Bitcoin market are heavily influenced by institutional participation, particularly through US spot Bitcoin Exchange-Traded Funds (ETFs). These investment vehicles, launched earlier this year, were hailed as a game-changer for mainstream adoption and significant capital inflows into Bitcoin. However, recent data paints a less optimistic picture.

According to data from SoSoValue, US spot BTC ETFs have recorded a substantial $403.9 million in net outflows this week. This figure is particularly concerning as it places the ETFs on track for a five-week outflow streak, unless a dramatic reversal with sharp inflows occurs on Friday. The continuous outflow signifies a waning of institutional appetite in the short term, or at least a period of profit-taking and reallocation. BlackRock’s IBIT and Fidelity’s FBTC, which saw immense initial success, have also experienced their share of fluctuations, with inflows diminishing or turning negative on certain days.
A sustained recovery in Bitcoin’s price, particularly one that aims to break through significant overhead resistance levels and achieve new all-time highs, is widely considered difficult to achieve without robust institutional participation. The initial excitement surrounding the ETF approvals generated considerable buying pressure, contributing to Bitcoin’s rally earlier in the year. The current trend of outflows suggests that institutions might be adopting a more cautious stance, possibly awaiting clearer market signals, macroeconomic stability, or more attractive entry points. Analysts believe that a turnaround in ETF flows, particularly a return to consistent net inflows, would be a strong bullish catalyst, indicating renewed institutional confidence and liquidity entering the market.
Bitcoin Price Prediction: Navigating Key Support and Resistance
From a technical analysis perspective, Bitcoin bulls have demonstrated resilience by maintaining the price above the immediate support level of $65,118. This indicates a consistent demand at lower price points, preventing a steeper decline.

- Bullish Scenario: To gain a decisive upper hand, buyers must successfully push the Bitcoin price above the 20-day exponential moving average (EMA), currently positioned around $71,247. A successful breach and sustained close above this EMA would signal a shift in momentum. Following this, the BTC/USDT pair could target the breakdown level of $74,508. This level is anticipated to be a strong resistance zone, with sellers likely to mount an aggressive defense. However, a definitive break above $74,508 would be a crucial indicator that a short-term bottom may have formed, potentially paving the way for an ascent towards the 50-day simple moving average (SMA), currently near $82,258. This move would signify a significant recovery phase.
- Bearish Scenario: Conversely, if sellers manage to exert enough pressure to pull the price below the $65,118 support level, it would signal a strengthening of bearish control. Such a breakdown could lead to a retest of the February 6 low of $60,000. This $60,000 level is expected to attract substantial buying interest from bulls, acting as a critical psychological and technical support. A failure to hold $60,000 would open the door for further downside, potentially challenging even lower support zones.
Broader Market Implications and Altcoin Performance
Bitcoin’s price movements often act as a bellwether for the broader cryptocurrency market. A significant rally in BTC typically pulls altcoins higher, while a sustained downturn can lead to broader market corrections. The current period of uncertainty for Bitcoin therefore casts a shadow over the altcoin market, where many assets are also struggling to find directional momentum. Traders are keenly observing whether buyers can collectively push Bitcoin and other major altcoins above their respective overhead resistance levels, signaling a broader market recovery.
Ether (ETH) Price Prediction: Consolidation and Directional Uncertainty
Ether (ETH), the second-largest cryptocurrency by market capitalization, has been largely consolidating within a range of $1,750 and $2,111. This prolonged sideways movement reflects a prevailing uncertainty among traders regarding its next significant directional move. The Dencun upgrade earlier this year, while technically successful, has yet to translate into a sustained bullish trend for ETH.

- Bearish Outlook: There is minor immediate support for ETH around $1,897. However, if this level fails to hold, the ETH/USDT pair could drop further to the more substantial support at $1,750. This $1,750 level is considered critical, and bulls are expected to defend it fiercely. A decisive close below $1,750 would be a significant bearish signal, potentially leading to a decline towards $1,537, a level that has historically offered strong support.
- Bullish Outlook: The bulls can reclaim control if they manage a strong close above the $2,111 resistance. A successful breach of this level would likely trigger a rally, with the Ether price potentially ascending towards the 50-day SMA, currently around $2,665. While sellers are anticipated to resist this recovery at the 50-day SMA, a breakthrough would open the path for the pair to surge towards $3,045, marking a substantial reversal of recent trends.
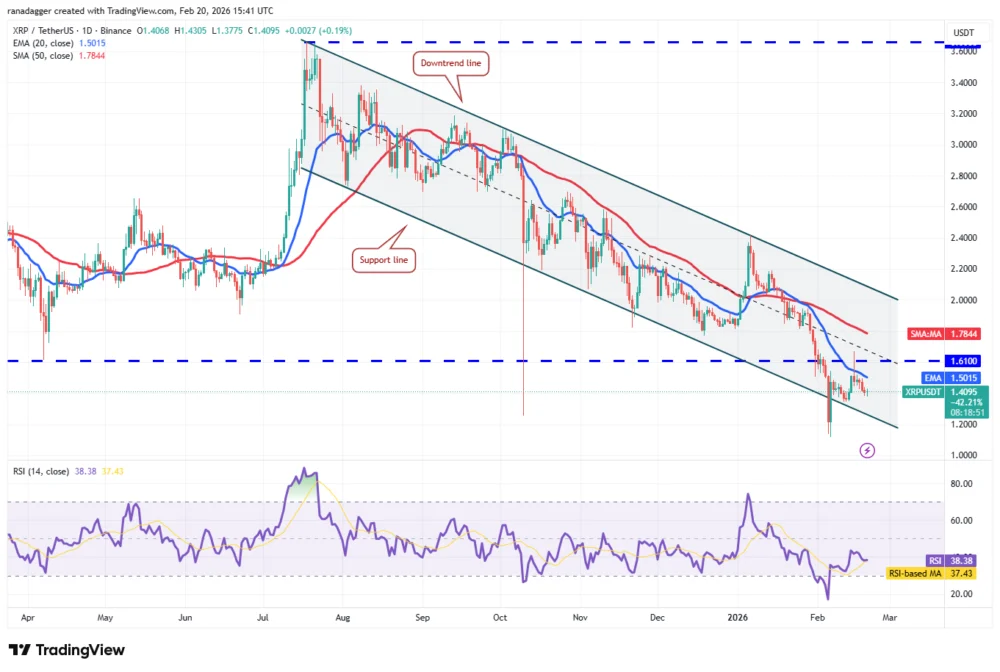
XRP Price Prediction: A Battle within a Descending Channel
XRP has faced considerable difficulty, with bulls failing to push its price above the 20-day EMA, currently at approximately $1.50. This inability to clear immediate resistance suggests a lack of robust demand at higher price levels, keeping the asset confined within a descending channel. The ongoing legal saga with the SEC continues to be an overhang, influencing investor sentiment and volatility.
- Neutral to Slightly Bearish: The XRP/USDT pair is likely to slide towards its support line within the descending channel. This support line represents a crucial demarcation. If the XRP price rebounds sharply from this line and successfully breaks above the 20-day EMA, it would indicate that the pair might continue to trade within the confines of the descending channel for an extended period, suggesting range-bound action. A definitive short-term trend change would only be signaled by buyers successfully piercing and closing above the downtrend line of the channel.
- Bearish Scenario: Conversely, a break and sustained close below the support line would be a strong indication that bears are firmly in control. Such a move could lead to a significant tumble for the pair, potentially reaching $1.11 and subsequently the psychological barrier of $1.00.
BNB Price Prediction: Sliding Towards Key Support
BNB, the native token of the Binance ecosystem, has been experiencing a gradual slide towards a critical support zone situated between $587 and $570. This downward trajectory indicates that bearish forces are currently dominating the market for BNB.

- Bearish Scenario: If the BNB price fails to find support within the $587-$570 zone and breaks below it, it would signal the initiation of the next leg of a downtrend. This could see the BNB/USDT pair decline towards the significant psychological level of $500. A breach of $500 could open the door for further downside, potentially targeting lower support levels.
- Bullish Scenario: This bearish outlook would be negated if bulls manage to stage a strong recovery and push the price above the $669 resistance level. A successful breakout above $669 would suggest a short-term shift in momentum, potentially leading the pair to rally towards the breakdown level of $730. Further strength could see it reach the 50-day SMA, currently around $797. Such a move would indicate that BNB may have established a short-term bottom and is attempting a recovery.
Solana (SOL) Price Prediction: Weak Bounce at Critical Support
Solana (SOL) bulls are currently attempting to maintain the price above the immediate support level of $76. However, the observed bounce from this level lacks significant strength, indicating a tentative hold. Solana’s ecosystem has seen considerable growth, but its price action remains sensitive to broader market trends.
- Bearish Scenario: The weak bounce heightens the risk of a definitive break below the $76 level. Should this occur, the SOL/USDT pair could experience a sharper decline, potentially plummeting to the February 6 low of $67. This $67 level is expected to be a strong area of defense for buyers. However, a close below $67 would be a significant bearish development, possibly leading to a further fall towards $50, a critical psychological and technical support zone.
- Bullish Scenario: The first clear sign of strength for Solana would be a break and sustained close above the breakdown level of $95. This would suggest that bearish pressure is weakening. If bulls can achieve this, the Solana price could then embark on a rally towards the 50-day SMA, currently hovering around $114. A move above $114 would indicate a more substantial recovery is underway.
Dogecoin (DOGE) Price Prediction: Standoff at the EMA
Dogecoin (DOGE) buyers have been actively trying to push the price above the 20-day EMA, positioned around $0.10, but have faced persistent resistance from bears. Despite this, a minor positive note for the bulls is that they have managed to prevent significant capitulation, holding ground relatively well. Dogecoin’s price remains heavily influenced by social media sentiment and broader market momentum.

- Bullish Scenario: The persistent defense by bulls, preventing a major slide, increases the probability of a successful breach above the 20-day EMA. If this occurs, the DOGE/USDT pair could rally towards the breakdown level of $0.12, which represents a key resistance point. A move beyond $0.12 would signal renewed interest and potential for further gains.
- Bearish Scenario: Conversely, if the Dogecoin price turns down decisively from current levels and breaks below $0.09, it would suggest that bulls have lost their battle. Such a breakdown could lead to a decline towards the critical support level of $0.08, a historical price point that has often attracted buying interest.
Bitcoin Cash (BCH) Price Prediction: Bears Taking the Reins
Bitcoin Cash (BCH) has recently slipped below its 20-day EMA, currently at $548, indicating that bears are attempting to seize control of its price action. As a fork of Bitcoin, BCH often mirrors some of its progenitor’s market sentiment but has its own distinct trading dynamics.
- Bearish Scenario: If the Bitcoin Cash price fails to reclaim and sustain itself above the 20-day EMA, the BCH/USDT pair could see a continued decline towards the next major support level at $500. This psychological level is expected to trigger a strong defensive reaction from buyers. However, a close below $500 would open the door for a more significant fall towards the vital support at $443, a level that has historically proven resilient.
- Bullish Scenario: For bulls to signal a reversal of the current bearish sentiment, they would need to decisively push and maintain the price above the 50-day SMA, currently around $575. A successful breach of this moving average could see the pair jump towards $600, and subsequently target $631. The zone between $631 and $670 is anticipated to be an area of aggressive selling by bears, representing a significant overhead resistance.
Litecoin (LTC) Price Prediction: Navigating Volatility with Key Supports
Litecoin (LTC), often referred to as "digital silver," has been experiencing a period of heightened volatility, bouncing off key moving averages. The asset has long been a staple in the cryptocurrency market, known for its faster transaction times compared to Bitcoin.

- Bullish Scenario: Bulls are attempting to drive the Litecoin price above the 20-day EMA, currently around $78. If they can achieve a sustained close above this level, it would signal renewed buying interest. The LTC/USDT pair could then target the overhead resistance zone of $85 to $90. A decisive break above $90 would be a strong bullish indicator, potentially leading to a rally towards the 50-day SMA, currently near $98, and possibly even the psychological $100 mark.
- Bearish Scenario: Conversely, if the price turns down from the 20-day EMA and breaks below the immediate support at $72, it would suggest that bears are gaining control. Such a move could lead the pair to slump towards the $65 support level, a historically significant area where buyers are expected to step in forcefully. A failure to hold $65 could open the door for a decline towards $58.
Cardano (ADA) Price Prediction: Struggle Against Downtrend Resistance
Cardano (ADA) buyers are currently struggling to push the price above its 20-day EMA, which stands at approximately $0.28. Despite this challenge, a small positive is that bulls have managed to prevent a significant capitulation, holding their ground in the face of selling pressure. Cardano is known for its research-driven approach and focus on scalability and sustainability.
- Bullish Scenario: Bulls will likely make renewed attempts to drive the Cardano price above the 20-day EMA. If successful, the ADA/USDT pair could then march towards a more formidable overhead resistance: the downtrend line. A definitive close above this downtrend line would be a crucial signal, indicating a potential short-term trend reversal and opening the door for further upward movement.
- Bearish Scenario: Sellers, however, are expected to maintain their pressure. Their objective will be to tug the price below the support line, which would signify a resumption of the prevailing downtrend. Should this occur, the next significant downside target is likely to be $0.15, a level that has historically provided strong support for ADA.
Monero (XMR) Price Prediction: Consolidation in a Bearish Channel
Monero (XMR), a privacy-focused cryptocurrency, has been consolidating within a downtrend, indicating that bears have successfully maintained their pressure over the asset. XMR’s unique privacy features set it apart, but its price action is still subject to broader market forces.

- Bearish Scenario: Sellers are poised to strengthen their position by attempting to pull the Monero price below the $309 level. A successful breach of this support could lead the XMR/USDT pair to drop towards the $276 level. This $276 level is expected to be a strong defensive point for buyers. However, a decisive close below it would be a significant bearish development, potentially sinking the pair further towards $247.
- Bullish Scenario: On the upside, for bulls to signal a shift in momentum, they would need to forcefully drive and maintain the price above the 20-day EMA, currently positioned around $360. A successful breakout above this moving average could see the pair climb towards the 61.8% Fibonacci retracement level, which is approximately $414. This would indicate a significant short-term recovery.
Conclusion: A Market at a Crossroads
The cryptocurrency market, led by Bitcoin, stands at a pivotal juncture. While historical data and certain technical indicators, such as the tightening Bollinger Bands, suggest the potential for a significant bullish reversal, the immediate reality of sustained outflows from US spot Bitcoin ETFs presents a formidable challenge. Institutional interest remains crucial for a broad and sustainable recovery.
The coming days will be critical in determining whether Bitcoin can break its bearish streak and reclaim key resistance levels, which would likely catalyze a broader altcoin market recovery. Conversely, continued institutional apathy and a failure to hold crucial support levels could prolong the period of consolidation or lead to further declines. Investors and traders are advised to remain vigilant, closely monitoring not only technical charts but also fundamental factors like ETF flows and macroeconomic developments, as these will collectively dictate the market’s trajectory in the near term.
This article does not contain investment advice or recommendations. Every investment and trading move involves risk, and readers should conduct their own research when making a decision. While we strive to provide accurate and timely information, Cointelegraph does not guarantee the accuracy, completeness, or reliability of any information in this article. This article may contain forward-looking statements that are subject to risks and uncertainties. Cointelegraph will not be liable for any loss or damage arising from your reliance on this information.