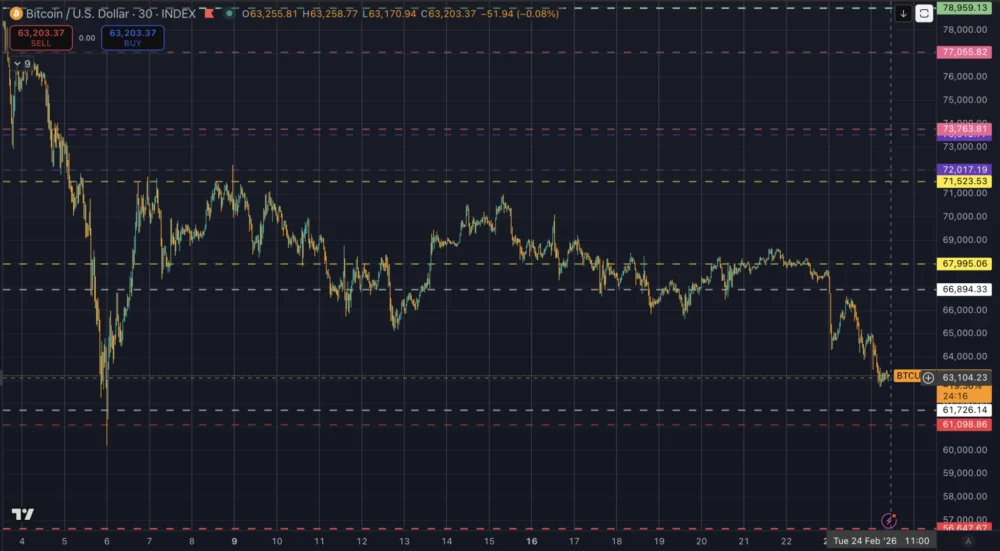
The decline was not a singular event but rather a series of cascading sell-offs that saw Bitcoin slide down a familiar set of technical "shelves." By the morning of February 24, 2026, the benchmark cryptocurrency was trading at approximately $63,214. This specific price point is significant as it places Bitcoin within the lower band of a well-documented two-year channel map, a technical structure that has historically dictated the boundaries of the prevailing market cycle. The failure to maintain the $65,000 handle suggests that the "repair" phase of the market has been postponed, replaced instead by a defensive posture as investors react to a shifting global trade landscape.
Chronology of the Downturn: A 48-Hour Technical Unwind
The descent began in earnest during the February 23 session. Bitcoin opened at $68,057, maintaining a relatively stable position within its upper trading range. However, the stability proved fleeting. Over the next 48 hours, the market experienced a 7.12% decline, culminating in a window low of $62,717. This move was not a gradual drift but a "procedural" repricing that occurred in distinct stages.
The first major signal of distress appeared on February 23 at 01:00 UTC. During this 30-minute window, the market witnessed a massive volume spike—approximately nine times the 48-hour volume moving average. This surge in selling pressure coincided with Bitcoin losing the $65,000 level, an area previously regarded as a psychological and technical floor. The sheer magnitude of the volume suggested a coordinated exit or a series of forced liquidations rather than organic retail selling.
The second stage of the decline manifested on February 24 at 05:00 UTC. During this period, the market printed its window low of $62,717. This move represented the first decisive push into the low $63,000 zone, effectively confirming that the "shelves" of the order book were giving way to lower bids. Throughout this 48-hour window, the high-to-low range widened to 8.80%, indicating a market that was "stepping through air pockets" rather than negotiating price in neat, incremental steps.
Technical Mapping: Decision Zones and the Repair Ladder
In the context of the two-year channel map, the current price action is viewed as a "ladder" where each rung represents a level of conviction. When a rung fails, the market rapidly searches for the next point of equilibrium. Analysts have identified several "overhead repair zones" that Bitcoin must reclaim to invalidate the current bearish thesis. These levels include $65,000, followed by $66,894, and finally $67,995. Until these rooms are revisited with high conviction, any upward movement is likely to be viewed as a "dead cat bounce" or mechanical hedging rather than a genuine trend reversal.
Conversely, the "downside decision zones" have become the primary focus for risk management. The immediate shelf sits between $61,726 and $61,099. This zone is described as the "hinge" of the current market structure. If Bitcoin manages to hold this level, it earns the time necessary to consolidate and attempt a slow rebuild. However, a failure to defend the $61,000 mark would shift the conversation from "repair" to "transfer," potentially opening the door to the next major support rung at $56,048.
The most ominous sign for long-term bulls remains the repeated failure at the $71,500 ceiling. Throughout previous months, Bitcoin attempted to breach this level seven times, each resulting in exhaustion. In technical analysis, once a market stops treating a ceiling as reachable, it inevitably stops treating the floors beneath it as sacred. The current price action is the downstream accounting of that exhaustion, where speed of decline is prioritized over the elegance of the trend.
Macroeconomic Catalysts: The Tariff Shock and Risk Aversion
While technical levels provide the map, macroeconomic factors provide the fuel. The recent crypto downdraft is inextricably linked to a "tariff shock" that has rattled global markets. Uncertainty surrounding trade policy, specifically the introduction of a 10% base tariff followed by discussions of a 15% increase by the Trump administration, has acted as a significant volatility lever.
For Bitcoin, which often trades as a high-beta liquidity asset, tariff uncertainty creates a "moving target" for valuation. Large-scale traders and institutional desks typically hedge their positions first and ask questions later. This "hedge-first" mentality has widened spreads across crypto exchanges and contributed to the thinning of the order book. When global trade tensions rise, the appetite for "risk-on" assets like cryptocurrencies typically diminishes in favor of the U.S. dollar or other defensive instruments.

Furthermore, the tariff narrative introduces inflationary concerns that complicate the Federal Reserve’s potential interest rate path. If tariffs are perceived as inflationary, the likelihood of sustained high interest rates increases, which historically exerts downward pressure on non-yielding assets like Bitcoin. This macro texture has turned what could have been a standard technical correction into a broader referendum on Bitcoin’s role in a fragmented global economy.
ETF Flows and the "Leaky Wrapper"
The role of U.S.-based spot Bitcoin Exchange-Traded Funds (ETFs) cannot be overstated in the current market environment. These instruments serve as the "plumbing" for institutional capital, and their flow data offers a transparent look at market sentiment. In mid-February, flow data began to show a net negative tilt, with large redemptions outweighing smaller, intermittent inflows.
In the "ETF era," these flows dictate how far a price move can run before hitting a wall. When the "ETF wrapper" begins to leak—meaning more capital is leaving the funds than entering—it creates a self-reinforcing cycle of selling. Authorized Participants (APs) must sell the underlying Bitcoin to meet redemption demands, adding spot market pressure that coincides with the technical breakdowns described earlier. The question now facing the market is whether these flows will stabilize at the $61,000 support level or if the institutional exit will accelerate as price discovery moves lower.
Derivatives and Hedging: Pricing in the Floor
The options market provides another layer of insight into professional sentiment. Recent data indicates a significant skew toward downside protection, with hedging pressure showing a -13% bias. This suggests that market participants are not just passive observers of the decline but are actively paying a premium to protect against a "terrifying new floor."
This hedging activity makes rallies feel mechanical. When Bitcoin attempts to climb back into a "repair zone" like $65,000, it often meets a wall of selling from traders who are using the bounce to exit or adjust their hedges. This behavior confirms that the market is currently prioritizing risk mitigation over capital appreciation. The options market is currently pricing in a distribution of risk that includes a 28% probability of Bitcoin closing below $60,000 within the next seven days, and an 8.5% probability of hitting $49,000 within a 30-day window.
Corporate Strategies and Long-Term Ledger Shifts
Amidst the volatility, a "corporate bid" story continues to run in the background. Entities following a consistent accumulation strategy—similar to MicroStrategy’s "Strategy" model—have been observed buying into the weakness. This type of accumulation is fundamentally different from the speculative flows seen in the ETF market. Corporate buyers often operate on a multi-year horizon, viewing the $63,000 level as an attractive entry point for long-term balance sheet holdings.
While this accumulation provides a counterweight to the selling pressure, it is rarely enough to halt a macro-driven decline in the short term. Instead, it shapes the "long-run ledger," determining who will hold the majority of the supply when the next cyclical upturn eventually begins. For now, the immediate price action remains a slave to macro risk and the mechanics of liquid flows.
Future Outlook: Three Likely Paths
As Bitcoin sits at the $63,000 mark, the market is facing three distinct scenarios for the coming weeks:
- Range Repair: If Bitcoin holds above the $61,000 shelf, the market will likely enter a period of "time trade." This involves sideways consolidation and slow rebuilding toward the $65,000 and $66,900 levels. This would signal that the tariff shock has been absorbed and that the "crypto winter" is entering a stabilization phase.
- Acceptance and Repricing: A sustained break below $61,000 would indicate market "acceptance" of lower valuations. This would likely lead to a fast repricing toward the $56,000 rung. In this scenario, the $49,000 bear thesis becomes a primary reference point for the market.
- The Macro Shock Wick: A swift and violent reclaim of $66,900 would frame the recent drop as a "wick" or a temporary liquidity grab driven by macro headlines. However, even in this bullish-leaning scenario, the $71,500 ceiling remains the ultimate test. Until that level is cleared, the broader trend remains cautious.
In conclusion, the loss of the $63,000 level is a sobering reminder of the hurdles facing the cryptocurrency market in 2026. The combination of technical failures, a "leaky" ETF infrastructure, and a volatile macroeconomic backdrop has created a environment where support is a daily referendum. Whether the "crypto winter" thaws or deepens depends entirely on the market’s ability to defend the $61,000 hinge in the face of ongoing global uncertainty.