The Mechanics of the Akiba Cycle Model v2
The updated model represents an evolution in quantitative analysis for the cryptocurrency sector. Moving beyond simple trend-line analysis, the framework utilizes a 50,000-run Monte Carlo simulation, a mathematical technique used to estimate the probability of various outcomes in an uncertain process. To ensure the robustness of its findings, the model incorporates walk-forward validation and leave-one-out cross-validation (LOOCV), methods designed to test the predictive power of a model by training it on historical data and testing it against "unseen" time periods.
The framework decomposes the Bitcoin cycle into three fundamental, interconnected components: the depth of the drawdown from the bull-market high to the subsequent cycle low, the duration (in days) from a halving event to that low, and the recovery multiple required to move from the low into the subsequent halving price. According to the data, the drawdown and timing components have historically shown the smallest margins of error, providing a high degree of confidence in the current projection of a $35,000 floor.

The model’s core premise is rooted in an empirical pattern observed across Bitcoin’s history: while peak-to-trough drawdowns remain deep by traditional financial standards, they have consistently eased with each passing era. This "monotone decay" suggests that as the Bitcoin market matures and liquidity increases, the extreme volatility that characterized its early years is gradually dampening, albeit while maintaining a clear four-year cyclical structure.
Historical Precedent: The Pattern of Diminishing Drawdowns
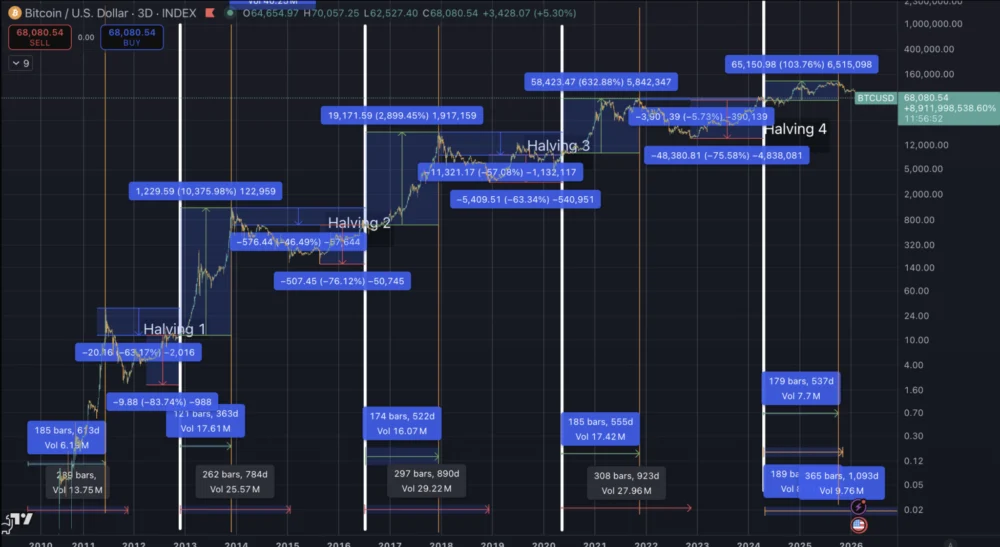
To understand the projected 72.5% drop to $35,000, one must examine the historical context of Bitcoin’s market corrections. Each successive cycle has seen a reduction in the percentage of value lost during bear markets. In the first cycle (H1), the drawdown from the peak to the trough was a staggering 94.1%. This was followed by an 88.2% correction in the second cycle (H2), 83.7% in the third (H3), and 77.6% in the fourth (H4).
The Akiba Cycle Model v2 fits a projection for the fifth cycle (H5) that centers on a median 72.5% drawdown. The simulation produces a remarkably tight band for this figure, ranging from 71.9% to 73.1%. This narrow distribution is attributed to the high level of consistency in the historical decay of volatility. When applied to the cycle high of $126,219, the model identifies a cluster in the mid-$30,000 range. Specifically, the median simulated low is calculated at $34,700, with a P10–P90 range (representing the 10th and 90th percentiles) of $33,900 to $35,500.

Temporal Projections: Why December 2026 is the Critical Window
Beyond price, the model provides a detailed timeline for the current market descent. Historical data suggests that Bitcoin cycles are not only becoming less volatile but are also lengthening. The number of days from a halving event to a cycle low has increased steadily:
- Cycle 1: 778 days
- Cycle 2: 784 days
- Cycle 3: 890 days
- Cycle 4: 923 days
For the fifth cycle, the estimate centers on a duration of 980 days following the April 2024 halving. This timeline maps directly to December 2026. The model’s window of highest probability spans from November 2026 to January 2027. While the timing error in backtesting (37 days) is wider than the drawdown error, it still reflects a statistically significant lengthening pattern. Market participants are increasingly viewing this "lengthening cycle" theory as a byproduct of institutional adoption and the introduction of spot ETFs, which have altered the liquidity profile of the asset.
The Recovery Multiple: Navigating the Widest Variable
While the model offers high confidence in the drawdown depth and timing, it acknowledges a significant degree of uncertainty regarding the "recovery leg"—the price action from the cycle low to the next halving. This component has historically been the most volatile and the least stable for predictive modeling.

The low-to-next-halving multiples have compressed dramatically over time. Into the second halving, the price saw a 347.8x increase from the low. This dropped to 67.2x into the third halving and 20.8x into the fourth. For the upcoming fifth halving (H5), the model estimates a central multiple of approximately 5.0x.
Due to the limited number of historical observations for this specific metric, the simulation utilizes a wide uncertainty band for the H5 halving price. The projected range is vast, spanning from $60,000 to $489,000, with a median expectation of $172,000. This suggests that while the model is relatively certain about a drop to $35,000, the path of the subsequent recovery remains subject to a multitude of external factors, including macroeconomic shifts and regulatory developments.
Backtesting and Model Reliability
The credibility of the Akiba Cycle Model v2 is bolstered by its performance in historical backtesting. When the model was trained on data from the first three cycles to predict the fourth, the results were remarkably close to actual market performance.

- Drawdown: The model predicted a 78.2% drawdown; the observed figure was 77.6% (a 0.6% gap).
- Timing: The model projected 929 days to the cycle low; the actual result was 923 days (a six-day gap).
- Price: The model projected a cycle low of $15,012; the actual low was $15,474 (a 3% variance).
However, the same backtest underpredicted the recovery multiple by 38%, highlighting why the model treats the post-low recovery as a "scenario space" rather than a primary forecast. This distinction is crucial for investors who use such data for risk management; the "floor" is statistically more predictable than the "ceiling."
Broader Market Implications and Institutional Context
As of February 27, 2026, Bitcoin remains the dominant force in the digital asset space, holding a market capitalization of $1.32 trillion and a dominance of 58%. The total crypto market is valued at $2.28 trillion. The projection of a 50% loss in value before December poses significant questions for institutional holders who entered the market during the post-2024 halving surge.
Since the approval of spot Bitcoin ETFs in early 2024, the market has seen a massive influx of traditional capital. Analysts suggest that if the Akiba Model’s projections hold true, the "diamond hands" of institutional investors will be tested. Unlike previous cycles driven primarily by retail speculation, the current cycle is influenced by corporate treasuries, pension funds, and sovereign wealth interests.

The model’s documentation notes several limitations, most notably its exclusion of regime variables such as ETF flow patterns, custody structures, and macro-correlations with interest rates and global liquidity. In a high-interest-rate environment, the "opportunity cost" of holding a volatile asset through a 72.5% drawdown may lead to different selling behaviors than seen in previous eras of "easy money."
Conclusion: A Structural Floor in Sight
Despite the bearish outlook for the remainder of 2026, the model provides a silver lining for long-term believers in the asset class. Under the model’s structural floor assumptions, there is a 100% simulated probability that the cycle low will remain above $20,000. Furthermore, there is a 64.4% chance that the price at the time of the H5 halving will exceed the previous cycle high of $126,219.
For market participants, the v2 framework formalizes two critical regularities: a drifting (decreasing) drawdown rate and a lengthening path to the cycle bottom. While the projected drop to $35,000 may cause short-term alarm, it aligns with the historical maturation of Bitcoin as a financial asset. As the market moves toward the projected December 2026 low, the focus will likely shift from speculative gains to the stability of the underlying cycle theory and the resilience of the digital gold narrative.