The recent price action unfolded against a backdrop of escalating geopolitical tensions in the Middle East, specifically involving Iran and the United States. While such uncertainty often triggers a flight to safety in traditional assets like gold, Bitcoin’s reaction has been particularly resilient, decoupling from traditional risk-on assets that struggled during the same period. The confluence of extreme oversold conditions, a resurgence in U.S. institutional demand, and a "washed-out" derivative market has created a structural setup that analysts describe as a "tinderbox" for an upward move.

A Statistical Anomaly: The Road to an Oversold Bottom
To understand the magnitude of the current rebound, one must look at the conditions that preceded it. According to data from K33 Research, Bitcoin entered the current week in a state that was statistically abnormal. Following five months of downside price action, the asset had shed 50% of its value from previous highs. Vetle Lunde, Head of Research at K33, noted that the weekly Relative Strength Index (RSI)—a momentum oscillator that measures the speed and change of price movements—had plummeted to its third-lowest reading in Bitcoin’s history.
This level of exhaustion typically indicates that the selling force has been spent. Historically, when Bitcoin’s weekly RSI reaches such depths, it has signaled a generational bottoming process. The market was not only oversold but also "underowned." Institutional investors, who had been aggressive buyers throughout 2024, had significantly pared back their exposure during the winter months. Notional open interest on the Chicago Mercantile Exchange (CME) had fallen by 30% from its October peaks, and spot Bitcoin ETFs had seen nearly 100,000 BTC in cumulative outflows during the preceding downturn.

The Mechanics of a Looming Short Squeeze
A short squeeze occurs when the price of an asset rises unexpectedly, forcing traders who had bet on a price decline to buy back the asset to close their positions. This forced buying creates a feedback loop that drives the price even higher. Current market data suggests the ingredients for such a squeeze are now in place.
Throughout February, the "funding rate" for perpetual futures—the cost traders pay to maintain their positions—remained unusually low or negative. In a typical bull market, long-positioned traders pay a premium to short-sellers. However, K33 Research pointed out that traders were recently paying premiums to maintain short positions, a behavior that is atypical for Bitcoin and usually coincides with the final stages of a bear cycle.

As Bitcoin surged back toward $70,000, these short-sellers were caught off guard. Data from CryptoQuant indicates that the "taker buy-sell ratio" on Binance reached 1.18, its highest level this year. This metric measures the ratio of buy volume to sell volume in the derivatives market; a reading above 1.0 suggests that aggressive buyers are overwhelming sellers. On several occasions during the recent rally, taker buy volume exceeded $1 billion per hour, suggesting that short-sellers were being forced to cover their positions rapidly as the price moved against them.
Chronology of the Reversal: From Panic to $70,000
The path back to $70,000 was paved by a series of critical market shifts over the last several trading sessions:

- Late February: Bitcoin hits its local bottom as the weekly RSI reaches historic lows. Sentiment indices show "extreme fear" as geopolitical headlines regarding Iran dominate the news cycle.
- February 26 – March 1: U.S.-based spot Bitcoin ETFs begin to see a reversal in flow trends. After weeks of outflows, the "New Nine" ETFs, led by BlackRock and Fidelity, record five days of inflows out of six trading days.
- March 2: The Coinbase Premium Index turns positive. This indicates that the price of Bitcoin on Coinbase (a proxy for U.S. demand) is higher than on offshore exchanges like Binance, signaling that American institutional and retail buyers are re-entering the market.
- March 3: Bitcoin tests the $68,000 resistance. Long-term holder distribution—selling by investors who have held for more than 155 days—subsides significantly as the asset holds its 200-week moving average.
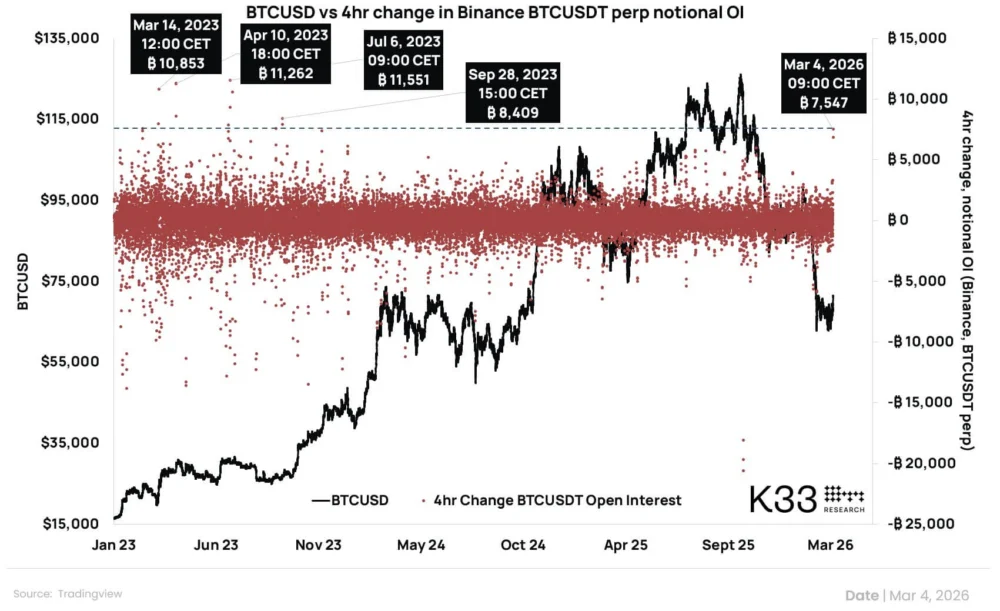
- March 4: A high-volume surge pushes Bitcoin above $71,000. Notional open interest on Binance’s BTCUSDT perpetual contract grows by over 7,500 BTC in a single four-hour window, the largest such jump since 2023.
The Role of U.S. Demand and ETF Inflows
A primary driver of the current momentum is the re-engagement of the U.S. market. The Coinbase Premium Index has been a reliable indicator of the rally’s sustainability. When the index is positive, it suggests that the rally is driven by "spot" buying (purchasing the actual asset) rather than just speculative leverage in the derivatives market. Since the index turned positive in late February, Bitcoin has gained approximately 15% in value.
Furthermore, the scale of ETF inflows cannot be overstated. In the last six trading days, cumulative inflows into spot Bitcoin ETFs exceeded $1.6 billion. This influx of capital provides a "liquidity floor" that absorbs selling pressure from miners or short-term speculators. According to CryptoQuant, this renewed institutional appetite is a direct response to the perceived resilience of Bitcoin as a "digital gold" hedge, especially as European energy prices surged by 70% and South Korean equities saw a 12% decline amid global instability.

Technical Hurdles: Is $70,000 a Ceiling or a Floor?
Despite the bullish momentum, the $70,000 zone remains a highly contested battlefield. Analytics firm Glassnode has identified the $69,400 to $70,500 range as a significant "liquidity sweep" area. Historically, this level has triggered intense profit-taking. Glassnode’s data shows that whenever the 12-hour simple moving average of net realized profit and loss rises above $5 million per hour, the price tends to stall.
Bitunix crypto exchange analysts have characterized the recent move as an "upside liquidity sweep." They noted that while much of the "long" leverage below $68,000 has been cleared out, the market still faces a "demand problem" at higher levels. For Bitcoin to sustain a move toward $75,000 and beyond, it must demonstrate "firm acceptance" above $70,000—meaning it needs to trade at that level for several days with high volume to turn previous resistance into new support.

If Bitcoin fails to hold the $69,800 level, analysts warn of a potential pullback to secondary liquidity zones near $64,000. However, if a high-volume breakout occurs, the resulting "forced short covering" could accelerate the rally toward new all-time highs.
Broader Market Implications and Analyst Outlook
The implications of Bitcoin’s return to $70,000 extend beyond the crypto-native ecosystem. The asset’s ability to rally while traditional markets in Asia and Europe faced steep declines suggests a growing "decoupling" narrative. Investors appear to be increasingly viewing Bitcoin as a neutral collateral asset that operates outside the traditional banking system—a sentiment bolstered by recent reports of unrealized losses totaling $337 billion within the U.S. banking sector.

Vetle Lunde of K33 Research suggests that the current setup is one of the most favorable for bulls in recent months because the "weak hands" have already been shaken out. The reduction in CME open interest and the washout of perpetual funding rates mean that the market is no longer "top-heavy" with speculative leverage.
As the market enters the second week of March, all eyes remain on the U.S. inflation prints and further geopolitical developments. If the U.S. spot demand continues to lead the way and ETF inflows remain consistent, the "brutal short squeeze" that analysts fear could become the defining market event of the first quarter. For now, Bitcoin has sent a clear message: the period of heavy selling has met its match in a renewed wall of demand, and the $70,000 "escape hatch" has officially been opened.