The Evolution of Price Channel Analysis in the ETF Era
Since the launch of spot Bitcoin Exchange-Traded Funds (ETFs) in early 2024, the market structure of the leading cryptocurrency has undergone a significant transformation. The influx of institutional capital and the integration of Bitcoin into traditional brokerage accounts have introduced a new layer of price sensitivity to global risk-on and risk-off sentiment. In response to this shifting landscape, analysts have turned to more sophisticated price-channel frameworks to identify zones of liquidity and historical reaction.
The recently introduced Akiba Price Channel Indicator represents a culmination of over two years of manual data tracking. Unlike automated indicators that rely solely on mathematical moving averages or standard deviations, this framework utilizes horizontal price channels built from a combination of psychological round numbers, historical reaction zones, order-book depth, and leveraged futures accumulation. By identifying these specific "working levels," the indicator seeks to map market structure rather than predict directional outcomes. The goal is to provide a cleaner read on where the market has historically reacted and where it is statistically likely to do so again.
Quantitative Analysis of Market Interactions
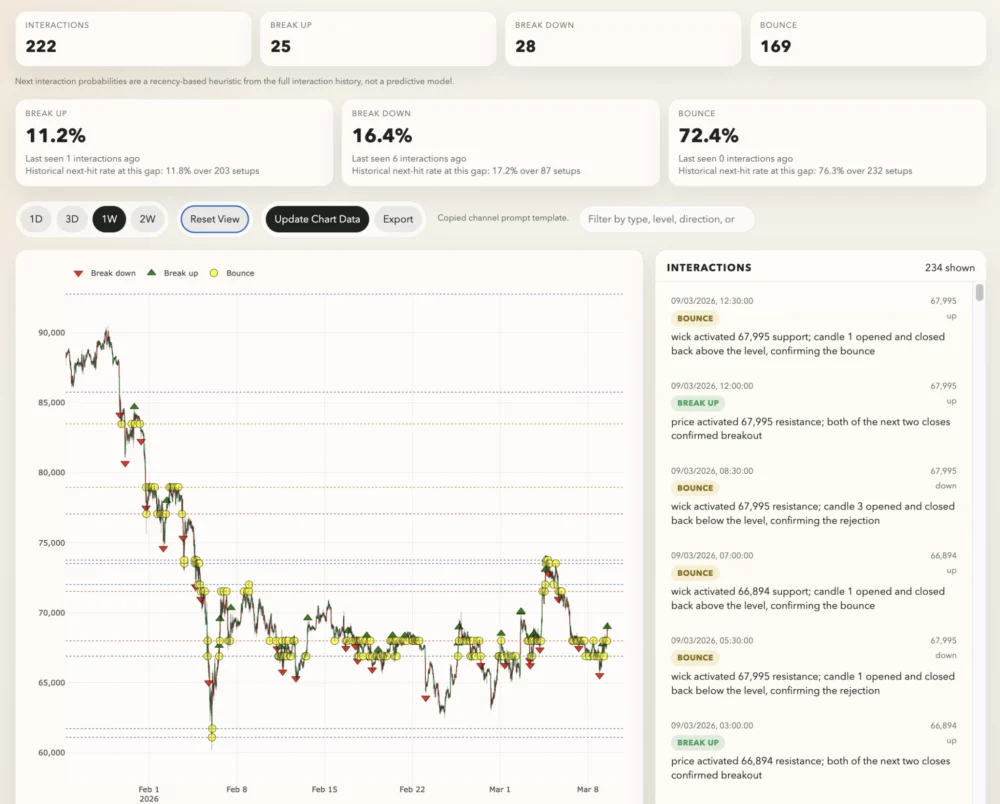
A comprehensive review of the dataset behind this indicator reveals a strong historical bias toward price "bounces"—situations where the price reaches a boundary and reverses—rather than clean breakouts or breakdowns. Across a full sample of 234 recorded interactions, the data shows 178 bounces, 30 breakdowns (downside moves through support), and 26 breakouts (upside moves through resistance). This results in a bounce probability of 76.1%, suggesting that Bitcoin remains range-bound more often than it enters a new trending phase.
Recent data following the market activity since March 3 confirms this trend. During this shorter window, the indicator recorded 54 interactions, consisting of 41 bounces, seven breakdowns, and six breakouts. Based on a recency heuristic—an analytical tool that weighs recent performance more heavily—the probability for the next interaction is calculated at 72.4% for a bounce, 16.4% for a breakdown, and 11.2% for a breakout. This statistical lean reinforces the view that the market is currently in a state of repair and consolidation rather than the early stages of an aggressive expansion.
Chronology of the Weekend Recovery: March 6 – March 10
The price action over the last several days provides a clear case study in how these technical levels function under pressure.

Friday, March 6 – Saturday, March 7: Bitcoin initially traded within the $68,000 to $71,500 range. However, as geopolitical news regarding the Iran conflict began to circulate, risk appetite diminished across global markets. By late Saturday, Bitcoin broke below the $68,000 pivot level, a move that was "accepted" by the market as price spent roughly 48 hours trading beneath this line and pressing toward the next support tier.
Sunday, March 8: The selling pressure intensified, leading to a brief but significant breakdown below the $66,894 mark. This level represents the "failure line" or the top of a lower channel extending down to $61,700. For several hours, there was a risk that Bitcoin would establish a new, lower base of operations, potentially leading to a deeper liquidation toward the $61,000 region.
Monday, March 9 – Tuesday, March 10: As institutional trading desks returned to their terminals, the downside move proved to be fragile. The breakdown below $66,894 was reversed within hours, a technical signal that the market did not accept the lower valuation. By Monday afternoon, Bitcoin had reclaimed the $68,000 level. As of the current session, Bitcoin is holding steady near $69,000, effectively repairing the damage from the weekend but remaining capped by overhead resistance.
Key Technical Levels and Working Reads
To understand the immediate path forward, analysts are focusing on four primary boundaries that have seen the highest volume of interactions in recent weeks.
The most critical level is $68,000. This boundary has recorded 25 interactions, the highest in the recent sample. Of these, 20 were bounces, three were breakdowns, and two were breakouts. This makes $68,000 the primary support and main pivot point for the current active range. The fact that Bitcoin reclaimed this level and then bounced from above it on March 9 is the strongest signal that a temporary floor has been rebuilt.
The second line of importance is $66,900. Acting as the "failure line," this level has seen 12 interactions, with eight resulting in bounces. The quick reversal of the March 8 breakdown suggests that buyers are still active in the $66,000-$67,000 zone, treating dips as opportunities rather than the start of a bear trend.

On the upside, $71,500 remains the primary ceiling. It has posted six interactions, five of which were bounces (rejections). Until Bitcoin can achieve sustained acceptance above $71,500, the market cannot be said to have entered a new expansion leg. Above this ceiling lies a "layered" resistance zone including $72,000 and a supply cluster between $73,500 and $73,800, which caused several failed pushes in the previous week.
Macroeconomic Headwinds and Geopolitical Pressures
The technical repair of Bitcoin’s price occurs against a backdrop of complex and often contradictory macroeconomic data. The Federal Reserve’s recent policy statement, which held interest rates at 3.5%-3.75%, emphasized that while inflation is cooling, it remains "somewhat elevated." January’s Consumer Price Index (CPI) came in at 2.4% year-over-year, while the core Personal Consumption Expenditures (PCE) price index—the Fed’s preferred inflation gauge—was recorded at 3.0% for December.
Simultaneously, the U.S. labor market is showing signs of softening. February payrolls decreased by 92,000, and the unemployment rate climbed to 4.4%. Historically, rising unemployment combined with sticky inflation creates a difficult environment for risk assets, as it limits the Federal Reserve’s ability to cut rates to stimulate growth without risking a resurgence in prices.
The bond and commodity markets have added further layers of complexity. The U.S. 10-year Treasury yield rose to 4.13% in early March, up from 3.97% just a week prior. Higher yields typically act as a gravity well for high-growth or speculative assets like Bitcoin. Furthermore, the conflict involving Iran sent Brent crude oil prices briefly to $119.50 before they settled near $101. These energy price shocks exacerbate inflation fears and drain liquidity from the system, explaining why the crypto market has been unable to sustain a clean breakout despite positive ETF flows.
Institutional Flows and Market Sentiment
Despite the macro uncertainty, institutional participation remains a stabilizing force. In the week of March 2, digital asset investment products saw inflows of approximately $1 billion, with Bitcoin accounting for $881 million of that total. This ended a grueling five-week streak of outflows that had seen $4.3 billion exit spot Bitcoin and Ethereum ETFs.
The "washout" of the previous month also led to a significant reset in market leverage. Futures open interest has declined to approximately $7.6 billion, and leverage ratios have dropped from 33% in October to 25% today. This reduction in "forced selling" potential is what allowed Bitcoin to find a floor so quickly after the weekend dip.

However, sentiment among options traders remains cautious. Reports from Bloomberg indicate that traders continue to favor downside protection (puts) over upside participation (calls), even as the price stabilizes. This skepticism aligns with the channel data, suggesting that while the floor is solid, the conviction for a massive rally is currently lacking.
Forward-Looking Scenarios: Base, Bull, and Bear
Based on the current market structure and macro environment, analysts have identified three primary paths for the remainder of the month.
The Base Case (50% Probability): Bitcoin continues to hold the $68,000 level but fails to clear $71,500 with conviction. In this scenario, the asset remains range-bound, oscillating between these two boundaries as it waits for clearer signals from the Fed or a de-escalation in geopolitical tensions. This path respects the historical 76.1% bounce rate.
The Bull Case (25% Probability): Bitcoin maintains $68,000 and manages to flip $71,500 from resistance into support. This would require a "risk-on" catalyst, such as a softer-than-expected inflation print or a cooling of energy prices. If $72,000 is cleared, the next targets are the $73,500-$73,800 supply zone, followed by the upper channel boundary at $77,000.
The Bear Case (20% Probability): Bitcoin loses the $68,000 pivot once again. If the asset begins to spend significant time below $66,900, the "failure line" is considered breached. This would open the door for a retest of the lower channel at $61,700 and potentially the $61,000 psychological support.
The Tail Risk (5% Probability): A severe macro shock, such as a direct escalation of the Iran conflict or a spike in inflation back toward 4%, could trigger a deep liquidation event. This would push Bitcoin into the lower-channel extremes of $56,650, a level not seen since the early stages of the 2024 rally.

Conclusion: A Market in Transition
The current state of the Bitcoin market is best described as a "repair inside uncertainty." The technical indicators suggest that a major drop was avoided when the $66,900 level was reclaimed with such speed. However, the lack of follow-through toward the $72,000 mark indicates that the bulls have not yet taken full control.
The Akiba Price Channel framework provides a disciplined roadmap for navigating this environment. By focusing on accepted moves versus fragile wicks, traders can distinguish between a durable shift in market structure and a temporary reaction to headlines. For now, the range is the dominant reality. Until Bitcoin can force a change in the status of the $71,500 ceiling, the most prudent interpretation is that the market is consolidating its gains and building a base for the next significant macro-driven move.