The Geopolitical Catalyst and the Oil Surge
The immediate catalyst for the current market tension is a deepening crisis in the Strait of Hormuz, a vital maritime artery through which approximately one-fifth of the world’s total oil consumption passes. Recent shipping disruptions in the region have stoked fears of a sustained supply shock, sending energy markets into a frenzy. According to market data, West Texas Intermediate (WTI) crude rose by 4.79% to settle at $92.04 per barrel, while Brent crude—the international benchmark—jumped 5.24% to reach $97.22.
The situation was further exacerbated by a stern warning from Iranian officials, who suggested that the global community should prepare for oil prices to hit $200 a barrel if the conflict continues to escalate. Such a price point would represent a catastrophic inflationary pressure for global economies, yet Bitcoin has remained remarkably steady. After reaching a daily high of $71,337, the asset retraced slightly to approximately $69,803, representing a modest 0.3% gain over a 24-hour period. This price action marks a departure from previous weeks, where rising oil prices and subsequent inflation fears routinely pushed the crypto market into localized corrections.
Deleveraging and Market Maturation
One of the primary reasons cited for Bitcoin’s ability to withstand the current macro headwinds is a fundamental shift in market structure. Data from CoinShares indicates that the "speculative froth" that characterized the market in late 2025 has largely dissipated. Leverage ratios in the Bitcoin market have dropped from roughly 33% in October 2025 to 25% by early March 2026, returning to long-term historical averages.
This reduction in leverage is a critical indicator of market health. High leverage often leads to "long squeezes," where a small dip in price triggers a chain reaction of forced liquidations, causing a price collapse. By entering the current geopolitical crisis with a cleaner market structure, Bitcoin was better positioned to absorb the shock. Furthermore, analysts estimate that approximately $30 billion in "whale distribution"—large-scale selling by long-term holders—occurred over the preceding five months. This period of selling effectively exhausted motivated sellers, leaving the market in what technical analysts describe as "oversold" territory despite the high nominal price.
The Institutional Floor: ETF Inflows and Strategic Accumulation
The emergence of US-based spot Bitcoin Exchange-Traded Funds (ETFs) has fundamentally altered the demand side of the equation. Following five consecutive weeks of outflows totaling roughly $4 billion, the tide turned in the first week of March 2026. Digital-asset investment products saw inflows exceeding $1 billion within a five-day window, signaling a renewed institutional appetite for the asset at current price levels.
Glassnode data confirms that flows into the 12 US spot Bitcoin ETFs are stabilizing. The seven-day moving average of these flows has returned to positive territory, providing a consistent "bid" in the market that counteracts the selling pressure from macro-driven fears. This institutional participation creates a price floor that was absent in previous cycles. Unlike retail speculators, institutional investors often operate on longer time horizons and are less prone to panic-selling during geopolitical flare-ups.
Additionally, the market is benefiting from "aggressive accumulation" strategies by major corporate entities. While the market mood has remained fragile, firms like MicroStrategy have continued their systematic purchase of the asset, absorbing sell-side liquidity across major exchanges. This cumulative volume delta rebound suggests that whenever "paper hands" or short-term speculators sell due to oil price news, institutional buyers are waiting to pick up the supply.

Historical Parallels and the MVRV Indicator
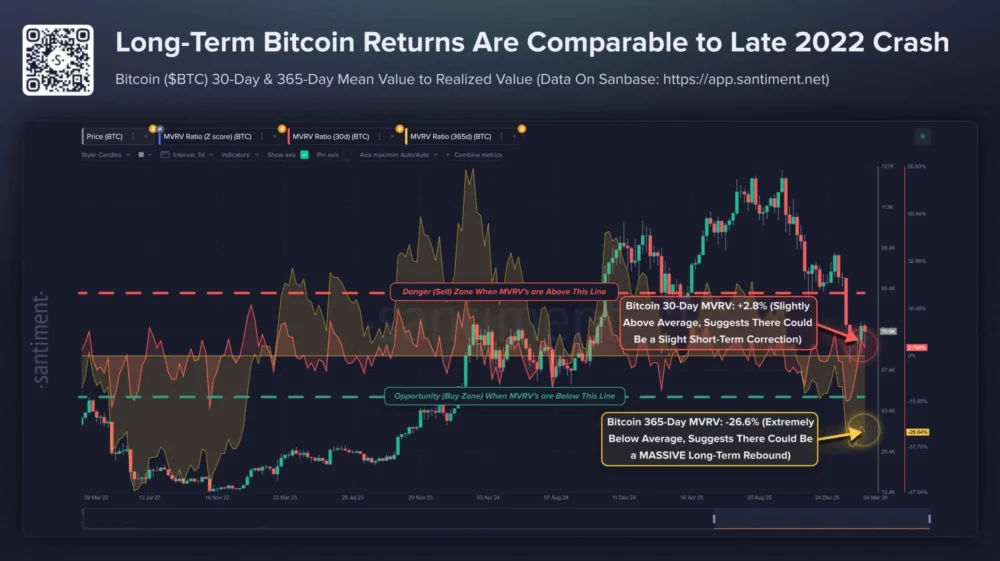
To understand the potential for an $80,000 "rip," analysts are looking at the Market Value to Realized Value (MVRV) ratio. Santiment’s 365-day MVRV data shows that long-term returns on the blockchain are currently at levels reminiscent of the final week of 2022. During that period, following the collapse of the FTX exchange, the MVRV was deeply negative, indicating extreme market distress. However, that phase was followed by a 67% price surge over the subsequent three months.
The current divergence is notable because it occurs under vastly different macro conditions. While the 2022 recovery was a rebound from a systemic industry failure, the current resilience is a stand against global economic instability. The fact that Bitcoin is holding its ground while long-term returns are relatively flat suggests that the asset is in a consolidation phase before a major breakout, rather than a speculative peak.
On-Chain Metrics: RVT and Liquidation Zones
Further supporting the bullish thesis is the Realized Value to Transactions (RVT) ratio. This metric compares the total realized capitalization of Bitcoin to the daily adjusted on-chain transfer volume. A rising RVT ratio, as observed by Alphractal, indicates that capital stored within the Bitcoin network is growing faster than the actual on-chain economic activity. Historically, this trend aligns with periods of accumulation where holders are "locking away" their coins rather than transacting them, reducing the available liquid supply on exchanges.
Liquidation data also provides a roadmap for the next major price move. Current data shows that the "maximum pain" for long positions—the price point where the most long traders would be forced out—sits around $61,000. Conversely, short positions are heavily concentrated near the $75,000 level. In a market where spot buying is firming up, these short positions become targets for a "short squeeze." If Bitcoin can break through the $72,600 resistance, the resulting liquidations of short sellers could provide the necessary momentum to propel the price toward $80,000.

The Options Market and Negative Gamma
The derivatives market is also signaling a bullish tilt for late March 2026. Data from the CME Group reveals a significant imbalance between call options (bets that the price will rise) and put options (bets that the price will fall). There is currently about $660 million in call open interest for March, compared to just $240 million in puts.
A critical factor in the potential move to $80,000 is the concept of "negative gamma." Approximately $2 billion of negative gamma is concentrated around the $75,000 strike price, with the majority of these contracts set to expire on March 27. In financial terms, when dealers have a "negative gamma" position, they are often forced to buy the underlying asset as its price rises to hedge their risk. If Bitcoin approaches the $75,000 mark, this dealer hedging could create a self-fulfilling prophecy, accelerating the price movement upward in a rapid "gamma squeeze."
Broader Economic Implications and Conclusion
The decoupling of Bitcoin from oil prices suggests that the digital asset is increasingly being viewed as a "neutral" reserve asset or "digital gold" rather than a mere high-risk tech stock. In an environment where the Strait of Hormuz conflict threatens the stability of fiat currencies by driving up energy costs and inflation, Bitcoin’s fixed supply and lack of geopolitical affiliation become attractive qualities for global capital.
However, the path to $80,000 is not without its risks. While the on-chain and derivatives data are leaning bullish, a further escalation in the Middle East that leads to a broader global conflict could still trigger a temporary liquidity crunch across all asset classes. For now, the combination of reduced leverage, institutional ETF support, and a favorable options setup suggests that Bitcoin is coiled for an expansion. If the current support levels hold, the "rip" to $80,000 may not just be a possibility, but a logical conclusion to the market’s current phase of maturation. As the March 27 options expiry approaches, all eyes will be on the $75,000 resistance level, which serves as the gateway to new all-time highs.