Bitcoin’s recent surge, propelling its price to an impressive $76,000, has undeniably rekindled a wave of optimism across the cryptocurrency market. This significant upward movement, occurring after a period of consolidation and uncertainty, has led many investors to anticipate the re-establishment of a robust bullish trend. However, a deeper dive into on-chain analytics and technical indicators suggests that while positive momentum is evident, the market may still be navigating the intricate and often volatile early stages of a broader recovery, rather than a full-fledged bull market confirmation. Key data points indicate a landscape defined by both opportunity and inherent risks, requiring a nuanced perspective from market participants.
The current market sentiment, while buoyant, is tempered by analyses from leading on-chain intelligence firms. Glassnode, a prominent provider of such insights, highlights that Bitcoin has entered what it terms a "relatively open" price corridor, specifically ranging between $72,000 and $82,000. This designation implies a zone where historical data points to less significant resistance, potentially allowing Bitcoin to move more freely if current buying momentum is sustained. This concept is primarily informed by the UTXO Realized Price Distribution (URPD), a crucial on-chain metric.
Navigating the "Open Zone": An On-Chain Perspective
The UTXO Realized Price Distribution (URPD) is a sophisticated tool used in on-chain analysis to understand the price points at which Bitcoin’s unspent transaction outputs (UTXOs) were last moved. Essentially, it maps out the historical accumulation prices of all existing Bitcoin. When a significant portion of UTXOs are concentrated at particular price levels, these areas often act as strong support or resistance zones, reflecting the average cost basis of a large number of investors. For instance, if many Bitcoins were last transacted (bought or sold) at $60,000, that level might present considerable selling pressure as those investors break even or take small profits, or conversely, strong buying interest if the price dips to that level, indicating strong conviction from prior buyers.

The current "open zone" identified by Glassnode between $72,000 and $82,000 signifies that there are fewer UTXOs whose last movement occurred within this particular range. In practical terms, this means that fewer investors currently hold Bitcoin with an average cost basis within this band, thus reducing the immediate selling pressure that might arise from holders looking to break even or realize modest profits. This relative scarcity of historical accumulation within this zone can facilitate smoother price action. If the market maintains its current positive momentum, Bitcoin could potentially traverse this range with less friction compared to price zones where heavy accumulation has occurred historically. However, the caveat remains: this "openness" is only advantageous if the underlying demand is sufficient to absorb any sporadic selling pressure that might emerge from short-term traders capitalizing on quick gains. The ability of the market to sustain momentum through this zone will be a critical test of the rally’s strength.
The Road to Profitability: A Key Recovery Metric
Beyond the structural aspects of price zones, a more fundamental signal for a sustainable recovery lies in the broader market’s return to profitability. Glassnode’s analysis reveals that the share of Bitcoin supply currently held in profit has climbed back to approximately 60%. This metric is a powerful gauge of investor sentiment and market health. Historically, a move to around 60% profitability is often observed during the nascent stages of a market recovery following a significant downturn. It indicates that a majority of the circulating supply is now held by investors who are "in the green," but it doesn’t necessarily signify a widespread, euphoric bull market.
To truly confirm the transition into an early bull market, Glassnode emphasizes the importance of a sustained push above the 75% profitability threshold. Reaching and maintaining this level would imply that a much larger proportion of investors, including many who might have bought at higher prices during previous cycles, are now seeing profits. Such a widespread return to profitability typically reduces the incentive for immediate selling and fosters stronger investor confidence, paving the way for more significant price appreciation. Conversely, if the profitability metric continues to face rejection near the current 60% level, it would lend more credence to the narrative of a "bear market recovery," where rallies are often temporary and ultimately yield to renewed downward pressure. The journey from 60% to 75% profitability is thus a crucial psychological and structural benchmark that market participants will be closely monitoring as a litmus test for the rally’s endurance.
Managing Selling Pressure: The Short-Term Holder Dynamic

Another critical factor influencing Bitcoin’s immediate trajectory is the behavior of short-term holders (STHs). These are typically newer investors or those who have held their Bitcoin for less than 155 days, and they are generally more reactive to price fluctuations compared to long-term holders (LTHs). As Bitcoin’s price surged past $74,000, on-chain data indicated a significant acceleration in profit-taking by STHs, with realized gains reaching an astonishing rate of $18.4 million per hour.
This rapid monetization of gains by short-term investors presents a dual challenge. On one hand, it demonstrates that there is sufficient liquidity and demand to absorb these sales, which can be seen as a sign of market strength. On the other hand, an excessive or sustained wave of profit-taking can act as a significant drag on upward momentum, effectively capping rallies. This pattern mirrors behaviors observed in past "failed rallies," where a strong initial surge was eventually overwhelmed by investors selling into strength, preventing a sustained breakout. For the current rally to evolve into a more durable upward trend, the market must demonstrate its capacity to absorb this sell-side pressure without losing critical support levels. Specifically, maintaining price stability above $70,000 is seen as paramount. If Bitcoin can successfully hold this support amidst ongoing profit-taking, it significantly increases the probability of a continued ascent into the $78,000 to $82,000 range, further validating the "open zone" thesis. The dynamic interplay between new demand and STH profit-taking will be a defining characteristic of this recovery phase.
Technical Barriers: Charting the Path Forward
From a purely technical analysis standpoint, the broader market structure still warrants a degree of caution. Despite the recent price surge, higher time frame charts, such as the daily and weekly, reveal that Bitcoin continues to trade within a pattern characterized by "lower highs and lower lows." This classic technical formation is indicative of a prevailing bearish market structure and suggests that a definitive bullish reversal has not yet been established. To signal a genuine shift in trend, Bitcoin would need to break convincingly above a previous significant lower high, for example, near the $97,855 mark referenced in the analysis. This level, or any other clearly defined previous lower high, represents a crucial resistance point that, if breached and sustained, would invalidate the existing bearish structure and pave the way for a more robust uptrend.
Furthermore, this region of critical resistance often aligns with significant Fibonacci retracement levels, particularly the "golden zone" between the 0.5 and 0.618 retracement levels. These Fibonacci levels are closely watched by traders as key decision points during trend reversals. A clean and decisive breakout above this "golden zone," followed by a period of consolidation where the price holds above the newly established support, would serve as a powerful confirmation of strong underlying demand. Such a technical validation would significantly increase the likelihood of a long-term rally, attracting more capital and solidifying investor confidence. Without such a structural break, the current rally could still be interpreted as a relief bounce within a broader downtrend, subject to further corrections.

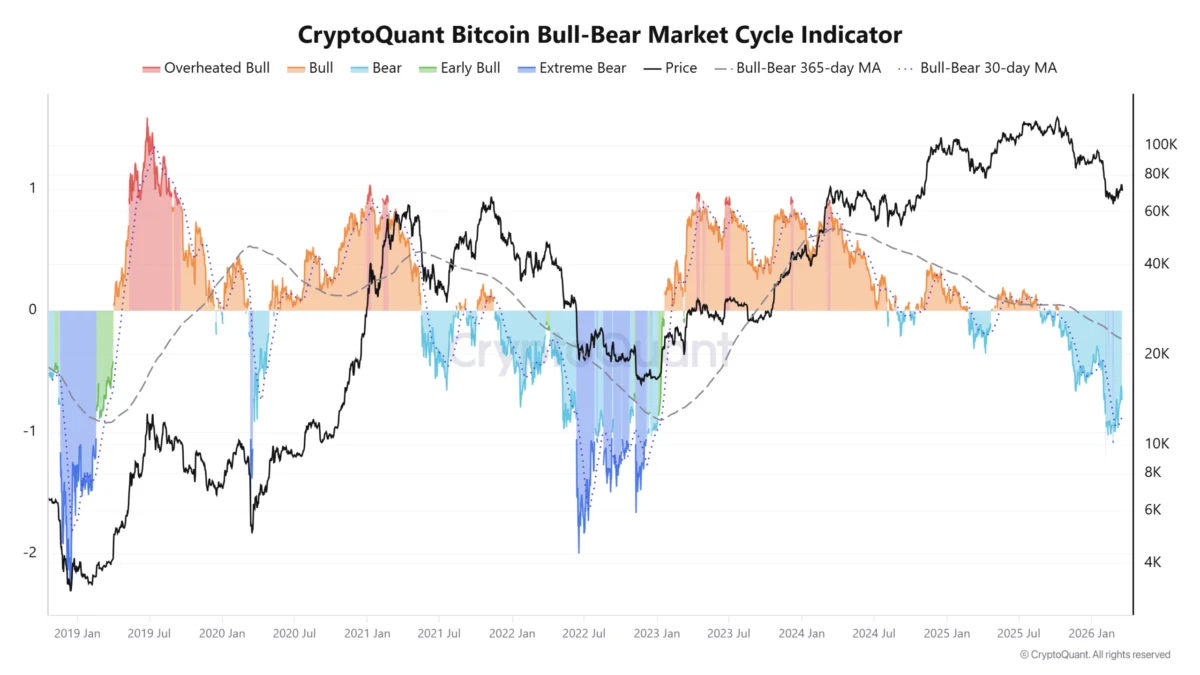
Broader Market Sentiment: CryptoQuant’s Cycle Indicator
Echoing the cautious outlook derived from on-chain and technical analysis, CryptoQuant’s proprietary Bitcoin Bull-Bear Cycle indicator also suggests that the market is far from confirming a full-fledged bull run. This indicator, designed to assess the overall market sentiment and momentum, provides a quantitative measure of whether Bitcoin is in a bull or bear market phase. While the indicator has shown some improvement, rising to -0.72 from -1 earlier in the month, it remains firmly entrenched in bearish territory. For the indicator to signal a definitive bull market confirmation, it would need to move significantly above the +1 threshold, reflecting sustained positive momentum and widespread bullish sentiment across various on-chain and market metrics.
An early signal that analysts are closely monitoring for a potential shift in long-term trend is a move above the bull-bear 365-day moving average, which currently sits at -0.23. This moving average acts as a long-term trend filter, smoothing out short-term market noise and volatility to provide a clearer picture of the underlying market conditions. A sustained move above this level would suggest that, on a higher time frame, the market conditions are gradually shifting from bearish to bullish, offering a preliminary indication of a potential trend reversal. Until such a move is observed, the indicator reinforces the narrative that the current rally, while encouraging, should be approached with strategic caution, as the overarching market cycle has not yet decisively flipped to bullish.
Historical Context and Macroeconomic Influences
To fully appreciate the current market dynamics, it’s crucial to place Bitcoin’s movements within a broader historical and macroeconomic context. Bitcoin is renowned for its cyclical nature, often experiencing dramatic bull runs followed by significant corrections, frequently tied to events like its halving cycles and broader economic conditions. Previous bull markets, such as those in 2017 and 2021, were characterized by sustained periods of high profitability, robust demand absorbing supply, and clear technical breakouts. The current recovery, while showing promising signs, still needs to demonstrate the breadth and depth of these past cycles.

Furthermore, the macroeconomic environment plays an increasingly significant role in shaping investor appetite for risk assets like Bitcoin. Factors such as global interest rates, inflation trends, and central bank monetary policies can either fuel or dampen speculative investments. High inflation and low-interest rates, for instance, often push investors towards alternative assets like Bitcoin as a hedge or growth opportunity. Conversely, rising interest rates and tighter monetary policies can reduce liquidity and make riskier assets less attractive. The ongoing global economic landscape, characterized by evolving inflation expectations and central bank postures, continues to exert a subtle yet powerful influence on Bitcoin’s ability to sustain its upward trajectory. The increasing institutional adoption, particularly through spot Bitcoin ETFs, has also introduced new dynamics, bringing traditional financial market participants and their capital into the crypto ecosystem, potentially altering volatility patterns and demand structures.
Strategic Implications for Investors
For investors, the current environment presents a complex picture demanding careful consideration. While the renewed optimism and potential for further gains are palpable, the underlying data signals that significant volatility and potential headwinds remain. This calls for a balanced approach that combines strategic positioning with prudent risk management. Long-term holders, often referred to as "HODLers," may view this period as an accumulation phase, strategically adding to their positions during dips, confident in Bitcoin’s long-term value proposition. Short-term traders, on the other hand, might seek to capitalize on the identified "open zone" and potential upward movement, while remaining vigilant for signs of increased selling pressure or technical rejection at key resistance levels.
Regardless of investment horizon, the importance of conducting thorough due diligence and not succumbing to speculative fervor cannot be overstated. Understanding the implications of on-chain metrics, technical analysis, and broader market indicators empowers investors to make more informed decisions. The ongoing debate between those who believe a new bull market is already underway and those who advocate for a more cautious "bear market recovery" narrative underscores the uncertainty inherent in these early stages. Ultimately, the market will dictate its path, and sustained confirmation across multiple analytical dimensions will be necessary to cement Bitcoin’s journey towards new all-time highs.
In conclusion, Bitcoin’s rally to $76,000 has undoubtedly injected a renewed sense of hope into the crypto sphere. However, a comprehensive analysis of on-chain data, technical indicators, and historical context reveals that this move, while significant, is more accurately characterized as an early-stage recovery. The presence of an "open zone," improving but not yet confirmed profitability metrics, and ongoing short-term holder profit-taking, coupled with persistent bearish technical structures and a cautious cycle indicator, all point to a market that is still navigating considerable hurdles. For a definitive and sustained bull run to materialize, Bitcoin will need to demonstrate its ability to absorb selling pressure, breach critical technical resistance levels, and usher a broader segment of the market into confirmed profitability. Until then, vigilance and a strategic approach remain paramount for all participants in this dynamic digital asset landscape.