As of March 23, 2026, spot gold was trading near $4,388 per ounce, representing a decline of approximately 22% from its record high of $5,594.82 established on January 29. This retreat meets the widely accepted definition of a bear market—a 20% or greater decline from a recent peak. In stark contrast, US spot Bitcoin ETFs have maintained a robust inflow streak, absorbing billions of dollars even as traditional safe-haven markets face intense liquidation pressure.
The Rapid Descent of Bullion
The downward trajectory for gold accelerated following the outbreak of a significant conflict in the Middle East on February 28, 2026. While geopolitical instability historically drives investors toward the perceived safety of bullion, the current macro environment has produced a different outcome. Since the onset of the conflict, gold has shed roughly 17% of its value, effectively erasing the gains achieved during the opening weeks of the year.
Market analysts point to a "dash for cash" as a primary driver for the sell-off. As the conflict forced a global repricing of energy expectations and economic growth, investors sought liquidity in money market funds rather than non-yielding physical assets. According to data from LSEG Lipper, global gold and precious metals funds recorded approximately $5.19 billion in weekly net outflows during the period ending March 18—the most substantial weekly withdrawal since the summer of 2018. During that same window, money market funds saw an influx of $32.57 billion, suggesting a clear rotation toward cash and short-term liquid instruments.

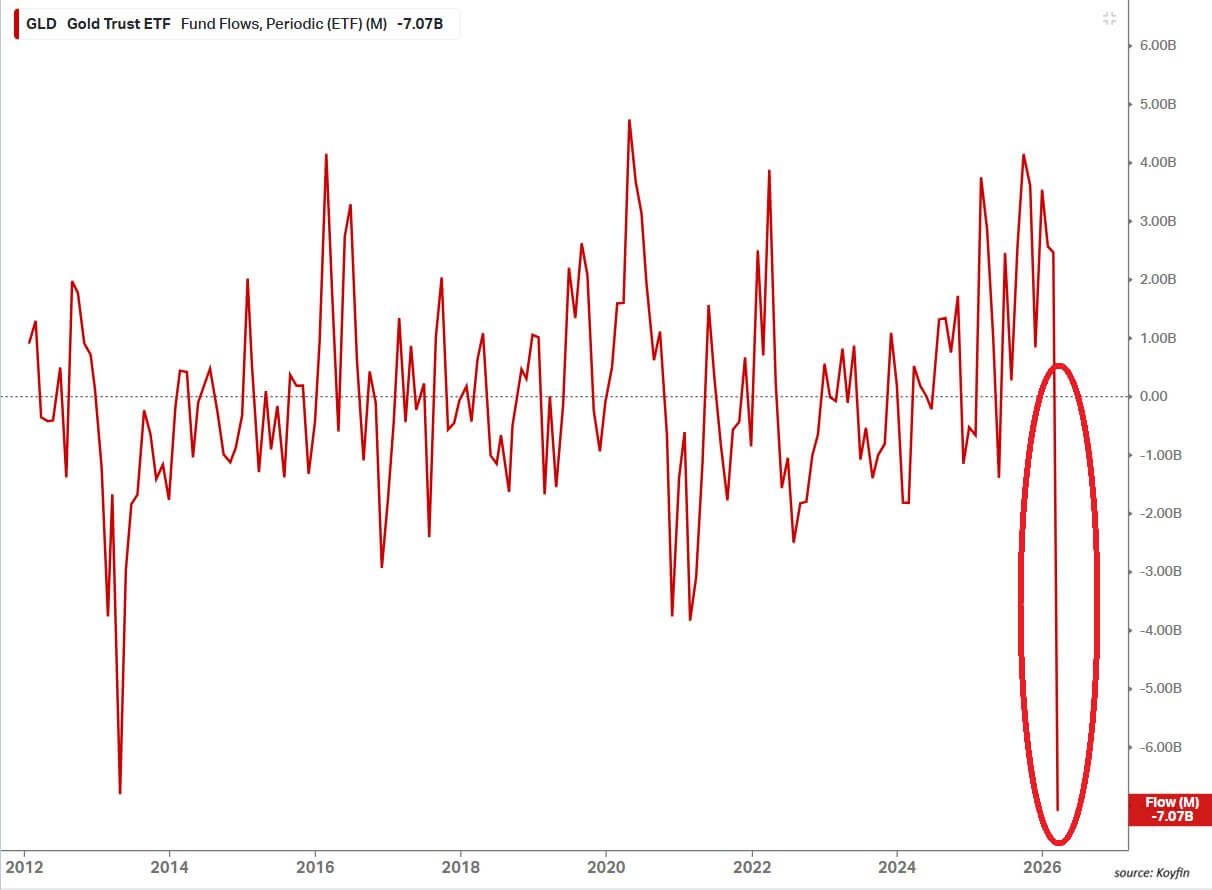
The institutional retreat from gold is further evidenced by the performance of the SPDR Gold Shares (GLD), the world’s largest gold-backed ETF. In March 2026 alone, GLD recorded $7.07 billion in outflows. This figure surpassed the previous monthly record of $6.8 billion set in April 2013, highlighting the velocity with which professional investors are unwinding their positions in the metal.
Bitcoin’s Institutional Resilience
While gold faced a mass exodus, the Bitcoin market displayed unexpected stability, bolstered by consistent demand from institutional brokerage and advisory channels. Data from Farside Investors indicates that the 12 US spot Bitcoin ETFs secured $2.42 billion in net inflows over the four calendar weeks ending March 20. This represents the longest sustained run of inflows in 2026 and the strongest period of accumulation since late 2025.
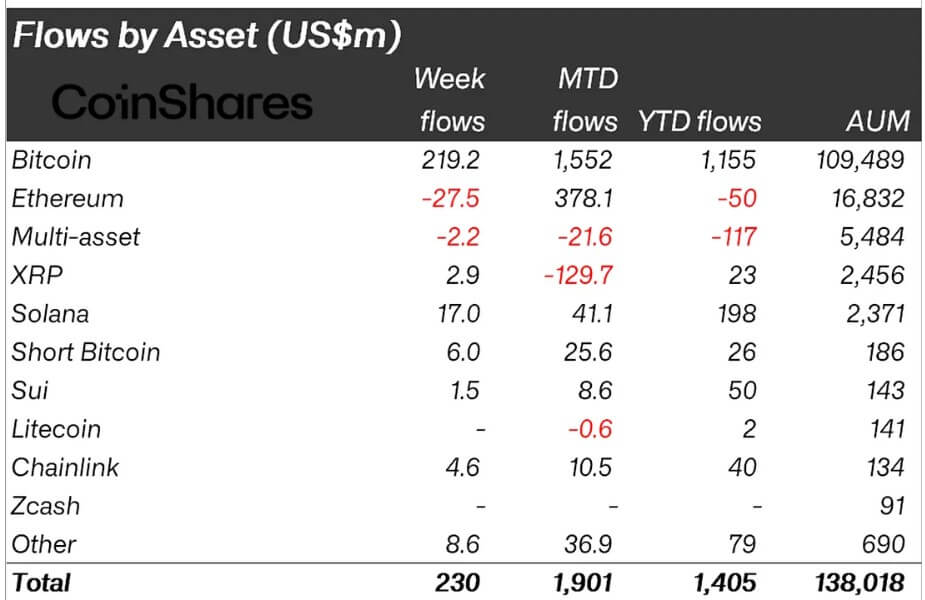
CoinShares reported a parallel trend on a global scale, noting that Bitcoin-related exchange-traded products (ETPs) have registered $1.5 billion in monthly inflows. The persistence of these flows suggests that institutional participants are no longer viewing Bitcoin solely as a speculative "risk-on" asset, but rather as a strategic component of a modern portfolio that can remain resilient even during periods of commodity volatility and shifting interest rate expectations.
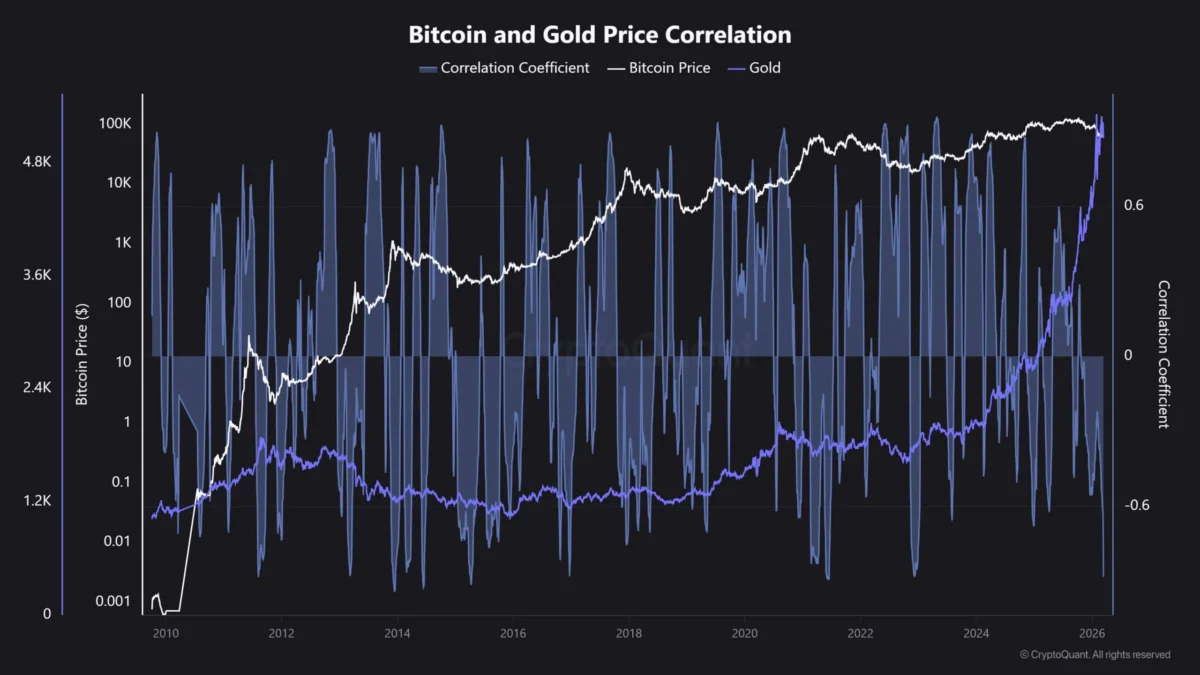
The divergence is perhaps best illustrated by the correlation between the two assets. According to CryptoQuant, the Bitcoin-to-gold correlation recently plummeted to minus 0.88. This is the lowest reading since the collapse of the FTX exchange in November 2022, signaling that the two assets are currently moving in opposite directions with remarkable force.

A Chronology of the 2026 Market Shift
To understand the current divergence, it is necessary to examine the sequence of events that reshaped market sentiment over the first quarter of 2026:
- January 29: Gold reaches an all-time high of $5,594.82, fueled by strong central bank demand and lingering inflation fears from 2025.
- February 28: A major geopolitical conflict erupts in the Middle East, initially causing a spike in energy prices but triggering a broader liquidation in assets as investors prioritize liquidity.
- March 11-12: The Federal Reserve concludes its policy meeting, holding interest rates steady and signaling a restrictive stance through the end of the year. The projection for the benchmark rate at the end of 2026 is set at 3.4%.
- March 18: LSEG Lipper data confirms the largest weekly gold fund outflow in nearly eight years ($5.19 billion).
- March 20: Bitcoin ETFs complete their fourth consecutive week of net inflows, totaling over $2 billion.
- March 23: Gold officially settles into bear market territory, down 22% from its January peak, while Bitcoin maintains its price levels despite broader market volatility.
The Macroeconomic Headwinds: Rates and the Dollar
The primary catalyst for gold’s underperformance is the Federal Reserve’s "higher-for-longer" interest rate policy. With core personal consumption expenditures (PCE) inflation remaining at 2.7%, the Fed has indicated that it will keep the benchmark rate elevated to ensure a return to its 2% target.
For gold, which pays no dividends or interest, high real yields represent a significant opportunity cost. When investors can earn a reliable 3.4% or more on government-backed debt or money market instruments, the appeal of holding physical bullion diminishes. Furthermore, the persistence of high rates has supported a firm US dollar. Since gold is denominated in dollars on global markets, a stronger greenback makes the metal more expensive for international buyers, further dampening demand.
Bitcoin, while also sensitive to liquidity, appears to be benefiting from a different set of drivers. Asset manager Bitwise noted that while gold has historically led Bitcoin by four to seven months in previous cycles, the current outperformance of crypto-assets over both gold and US equities suggests the early stages of a structural rotation. Institutional investors may be increasingly viewing Bitcoin as a hedge against "fiat dilution"—the long-term erosion of currency value—rather than a simple short-term inflation hedge.

Volatility Profiles and Risk Appetite
Despite the divergence in price action, the underlying risk profiles of the two assets remain vastly different. State Street Global Advisors, in its March 2026 gold monitor, highlighted the volatility gap that still defines these markets. Over a trailing 10-year period, Bitcoin’s rolling 30-day volatility averaged 52.0, compared to just 13.6 for gold.
The report also noted that between January 2016 and February 2026, Bitcoin experienced 30 separate months with losses exceeding 8%, while gold experienced only one such month. This data underscores that the investors currently moving into Bitcoin ETFs are consciously accepting higher levels of volatility and deeper potential drawdowns. The fact that they continue to buy in the face of such volatility suggests a long-term conviction that outweighs the traditional safety of the gold market.
Central Bank Support vs. Short-Term Liquidity
One of the most perplexing aspects of gold’s decline is that it follows a year of record-breaking structural demand. The World Gold Council reported that total gold demand in 2025 exceeded 5,000 metric tons for the first time in history. Central banks alone purchased 863 tons last year, and gold ETFs saw their holdings rise by 801 tons.
This structural support, however, has been overwhelmed by the sheer force of short-term macroeconomic conditions. While central banks may be long-term holders, the "hot money" in the ETF and futures markets is highly sensitive to interest rate fluctuations and the need for immediate liquidity. The current sell-off suggests that the speculative and investment-grade "top layer" of the gold market is being stripped away, even as the "floor" provided by central banks remains intact.
The Role of Energy and Future Projections
Looking ahead, the energy market is expected to play a decisive role in whether gold can recover or if Bitcoin will continue to widen its lead. Several major financial institutions have revised their 2026 oil price forecasts upward in light of Middle Eastern supply risks. Bank of America raised its Brent crude forecast to $77.50 a barrel, while Standard Chartered moved its projection to $85.50. Some extreme scenarios from Bank of America suggest a path toward $130 if supply disruptions become prolonged.
Higher oil prices act as a double-edged sword for these assets. On one hand, they fuel inflation, which theoretically benefits both gold and Bitcoin as hedges. On the other hand, sustained high energy costs could force the Federal Reserve to keep interest rates even higher for longer to combat cost-push inflation.
If rates remain high, gold will likely continue to struggle against the headwind of real yields. Bitcoin’s trajectory will depend on whether institutional risk appetite remains robust. If the Bitcoin ETF buyer base proves to be "sticky"—meaning they do not sell during periods of macro stress—the digital asset could further cement its status as a preferred alternative to traditional precious metals.
Broader Implications for the Global Portfolio
The shift observed in the first quarter of 2026 suggests a potential redefinition of the "safe-haven" asset class. For decades, gold was the undisputed destination for capital during times of war and inflation. However, the emergence of Bitcoin ETFs has provided a regulated, liquid, and easily accessible alternative that fits more naturally into the digital infrastructure of modern finance.
The move into bear market territory for gold is a signal that the traditional correlations of the 20th century may no longer hold in an era of high-speed digital trading and institutionalized crypto-assets. While gold’s long-term value as a reserve asset is unlikely to vanish, its dominance as the primary hedge for private-sector investors is facing its most significant challenge to date.
For now, the market’s message is clear: the certainty of a 3.4% yield is currently more attractive than the "barren" safety of gold, while the unique growth and scarcity properties of Bitcoin are attracting a new class of institutional buyers who are willing to look past the volatility. As the second quarter of 2026 approaches, all eyes will remain on the Federal Reserve and the energy markets to see if this historic divergence becomes the new permanent reality of the global financial system.