James Watt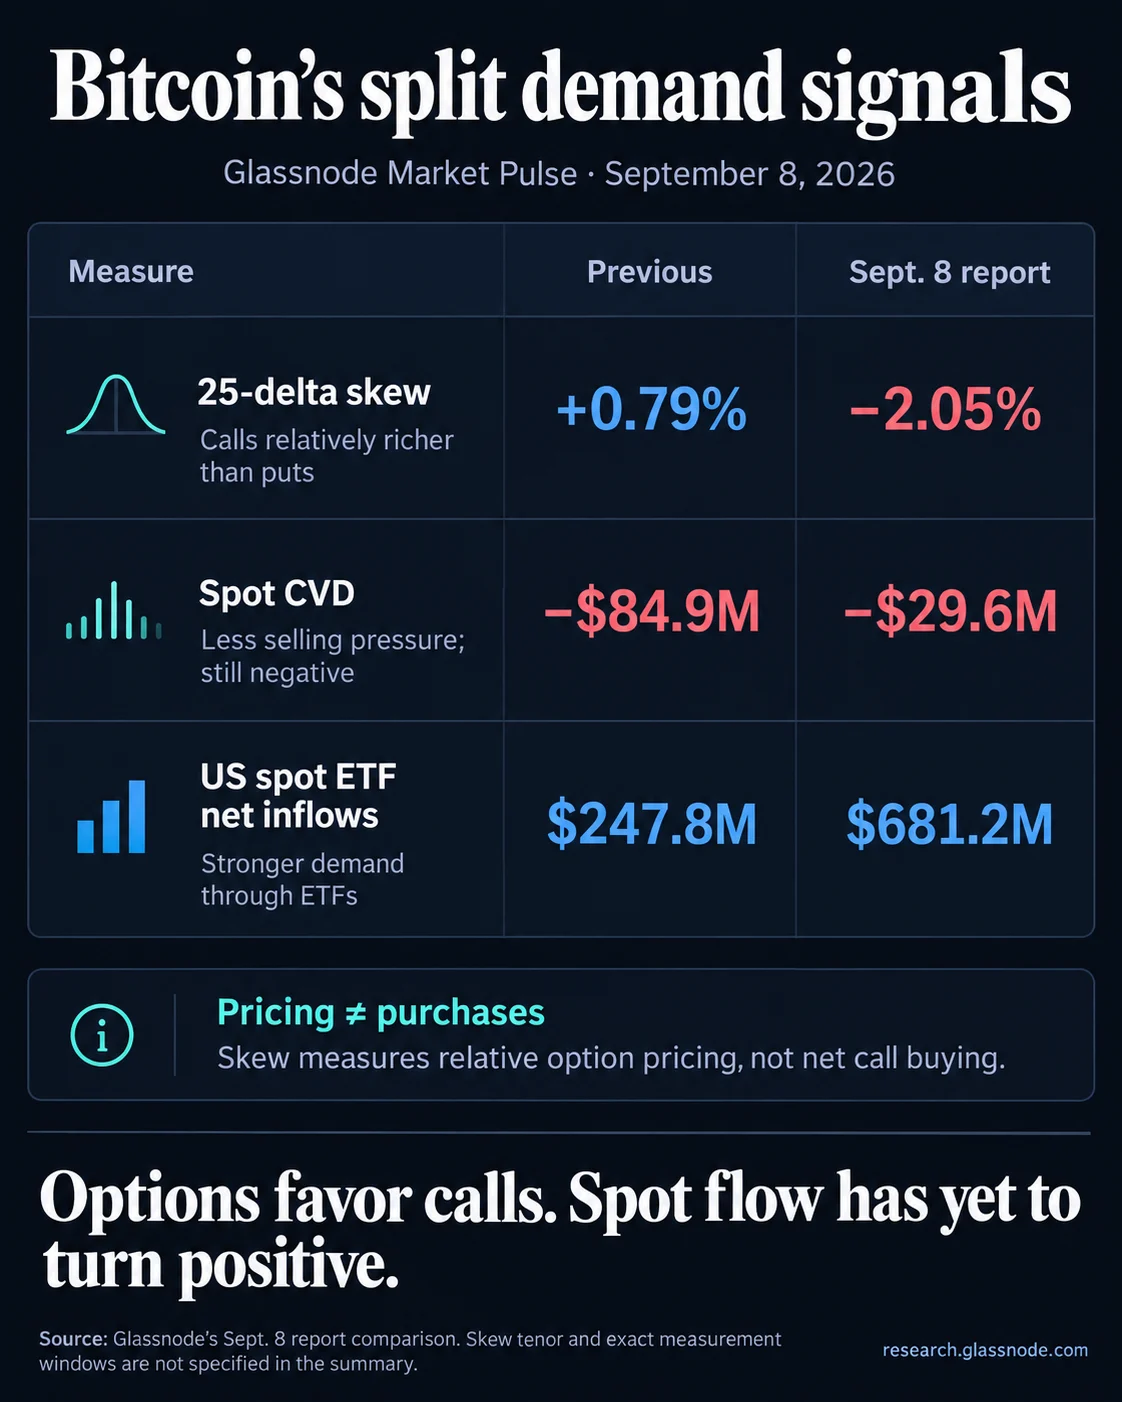
The Bitcoin market is currently navigating a complex period of internal divergence, characterized by a burgeoning optimism in the derivatives and institutional sectors that stands in stark contrast to a hesitant and sell-heavy spot market. While speculative traders and institutional investors through exchange-traded funds (ETFs) are positioning for a significant upward move, the immediate price action remains suppressed by aggressive selling on centralized exchanges. As of Tuesday, Bitcoin was trading at approximately $78,800, having failed to maintain a foothold above the psychologically critical $80,000 threshold. This tug-of-war between different market participants highlights a lack of broad-based participation, which analysts suggest is necessary to validate and sustain a definitive breakout.
The Divergence Between Speculative Positioning and Spot Demand
The primary narrative currently shaping the Bitcoin ecosystem is the disconnect between how traders are betting on future prices and how they are acting in the present. According to the latest Market Pulse report from Glassnode, the derivatives market has taken a decidedly bullish turn. This is evidenced by a significant shift in the options market and a surge in capital entering US-regulated investment vehicles. However, the "on-the-ground" reality on major crypto exchanges like Binance, Coinbase, and Kraken tells a different story.
On these centralized platforms, the cumulative volume delta (CVD)—a metric that measures the net difference between aggressive buying and selling—remains in negative territory. This indicates that for every trader attempting to push the price higher, there is an equal or greater amount of sell-side pressure absorbing that demand. This phenomenon often occurs when long-term holders or "whales" use periods of high liquidity and optimistic news to distribute their holdings, effectively capping the price despite positive sentiment elsewhere.
A Pivot in the Options Market: 25-Delta Skew Reversal
One of the most technical but telling indicators of this shifting sentiment is the 25-delta skew in the Bitcoin options market. Recently, this metric swung from +0.79% to -2.05%. In the world of crypto-derivatives, a negative skew indicates that call options (bets that the price will rise) have become more expensive relative to put options (bets that the price will fall).
Under Glassnode’s specific methodology, this move signals that traders are increasingly willing to pay a premium for upside exposure. It marks a sharp departure from the defensive, "wait-and-see" posture that dominated the market during previous weeks. When call options become "richer," it suggests that market participants are not just hoping for a price increase but are actively hedging against the risk of being left behind during a sudden rally. This "fear of missing out" (FOMO) among derivatives traders often precedes high-volatility events, though it does not guarantee the direction of the eventual move.
Institutional Momentum: The Acceleration of US Spot Bitcoin ETFs
Complementing the bullishness in the options market is a renewed vigor in institutional demand. Net inflows into US spot Bitcoin ETFs reached a substantial $681.2 million over the latest weekly observation period. This is a massive leap from the $247.8 million recorded in the prior week, representing a nearly 175% increase in capital allocation.
This influx of institutional money is particularly noteworthy because it provides a "real-world" foundation for the speculative optimism seen in derivatives. Unlike leveraged futures positions, ETF inflows represent the acquisition of the underlying asset (or a direct claim to it), which generally exerts a more permanent form of upward pressure on the market. The fact that regulated investment vehicles continue to draw significant capital even as Bitcoin struggles to stay above $80,000 suggests that institutional players view the current price levels as an attractive entry point or a necessary accumulation zone before a larger macro trend unfolds.
The Spot Market Reality Check: Understanding CVD
Despite the billions of dollars flowing through ETFs and options, the spot market remains the ultimate arbiter of price discovery. Glassnode’s spot cumulative volume delta (CVD) improved from negative $84.9 million in the previous week to negative $29.6 million. While the narrowing of this gap is a positive sign—indicating that selling pressure is beginning to exhaust itself—the fact that it remains negative is a hurdle for bulls.

A negative CVD means that "market" sell orders (those that hit the bid) are still outnumbering "market" buy orders (those that take the offer). For a sustained breakout above $80,000 to occur, the market typically needs to see a transition to a positive CVD, where buyers become aggressive enough to chase the price higher rather than waiting for it to come to them. Currently, the market is in a state of "passive accumulation," where buyers are absorbing sells but are not yet ready to lead the charge.
Perpetual Futures and the Leverage Landscape
The perpetual futures market, a favorite of retail and high-frequency traders, is also exhibiting signs of caution. Perpetual CVD remained negative at approximately -$176 million, and funding rates—the periodic payments made between long and short traders—have declined. In a typical bull run, funding rates soar as long-side traders pay a premium to maintain their positions. The current decline suggests that leveraged traders are becoming more disciplined or are perhaps skeptical of the market’s ability to clear the $80,000 hurdle in the immediate term.
Furthermore, total futures open interest remains elevated at $37 billion. High open interest combined with stagnant price action creates a "coiled spring" effect. If Bitcoin were to break decisively in either direction, this large amount of leverage could lead to a cascade of liquidations, either fueling a massive short squeeze toward $85,000 or a rapid deleveraging event back toward the $72,000 support zone.
Chronology of the Struggle for Eighty Thousand Dollars
To understand the current impasse, it is necessary to look at the timeline of Bitcoin’s recent price action:
- Late August: Bitcoin enters a consolidation phase following a mid-summer rally, with prices oscillating between $74,000 and $77,000.
- Early September: US Spot ETF inflows begin to pick up, coinciding with a shift in the Federal Reserve’s tone regarding interest rate cuts.
- September 5-7: Bitcoin makes its first attempt at the $80,000 level. While it briefly touches the mark, it is met with heavy sell walls on major exchanges, pushing it back to $78,000.
- September 8 (Present Analysis): Data reveals the significant pivot in 25-delta skew. Despite the price failing to hold $80,000, options traders begin aggressively buying calls, anticipating that the next attempt will be successful.
Broader Impact and Market Implications
The current market structure suggests a transition from a retail-led market to an institutionally dominated one. The aggressive selling on exchanges may be attributed to older "retail" wallets taking profits at historic highs, while the ETF inflows represent a new class of "sticky" capital.
If spot CVD turns positive while ETF inflows remain at these elevated levels, the resulting "supply shock" could be the catalyst that finally pushes Bitcoin into a new price discovery era. Conversely, if spot selling persists and begins to outweigh ETF demand, the derivatives market may face a "long squeeze," where traders who bought expensive call options are forced to exit their positions, leading to a temporary price correction.
For the market to achieve a "convincing" breakout, analysts are looking for a convergence of three factors:
- Sustained ETF Inflows: Continued weekly net totals above $500 million.
- Positive Spot CVD: A shift where buyers on centralized exchanges become the aggressors.
- Stability in Funding Rates: A moderate increase in funding that shows healthy, non-excessive confidence among leveraged participants.
Conclusion: The Path Forward
Bitcoin stands at a critical crossroads. The technical indicators from the derivatives and institutional sectors are flashing green, signaling a belief that the asset is undervalued even at nearly $80,000. However, the "friction" provided by spot market sellers remains the final obstacle.
As the market digests the current $37 billion in futures open interest, the coming days will be pivotal. A move above $80,000 backed by positive spot flow would likely confirm the bullish thesis held by options traders. Until then, the market remains in a state of high-tension equilibrium, waiting for one side of the trade to yield. The divergence between speculative optimism and actual spot demand is narrowing, but the final leap across the $80,000 threshold requires a unified front from both institutional and exchange-based participants.