James Watt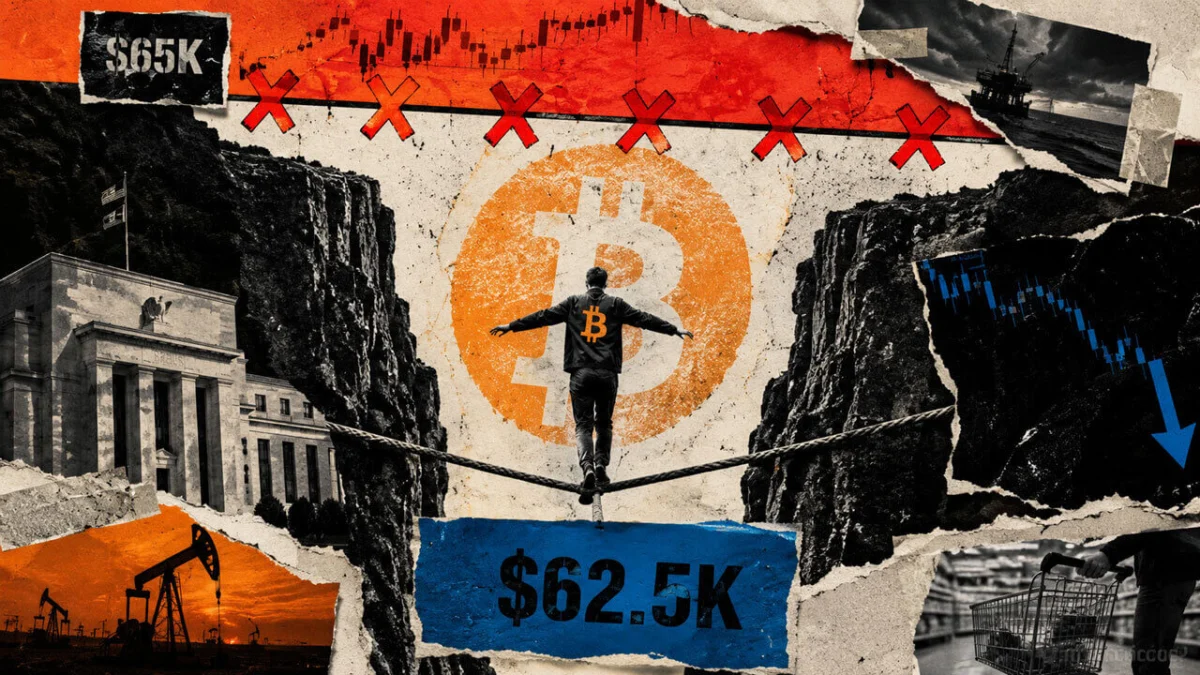
Bitcoin entered the mid-August weekend trading near the $62,900 mark, struggling to maintain upward momentum after a week characterized by favorable macroeconomic data that failed to translate into a sustained price rally. On August 14, the leading digital asset touched an intraday low of $62,538, a move that effectively tested the critical $62,500 to $62,560 support zone. This specific area has served as the foundational floor for a five-week trading range, which has seen the cryptocurrency fluctuate between $62,000 and $66,000 without a decisive breakout in either direction.
Despite the broader financial markets absorbing a series of cooling inflation reports and softening labor data with optimism, Bitcoin has remained remarkably stagnant. Data from Bitfinex indicates that the asset attempted to breach the $65,000 to $65,500 resistance region six times between August 5 and August 10. However, none of these attempts resulted in a daily close above the $65,000 threshold. Currently, Bitcoin sits less than 1% above its immediate support floor while requiring a rally of approximately 3.3% to reclaim the upper boundary of its current range.
A Week of Disconnect Between Macro Indicators and Crypto Performance
The second week of August provided a significant amount of "macro relief" that traditionally bolsters risk assets like Bitcoin. The labor market showed signs of cooling, with July payrolls falling by 23,000. Furthermore, revisions for May and June revealed a combined reduction of 103,000 jobs compared to previous estimates, suggesting a more rapid softening of the U.S. economy than initially anticipated.
Inflation data followed a similar trend. The July Consumer Price Index (CPI) rose by a modest 0.1% month-on-month, bringing headline inflation down to 3.4% on a year-over-year basis, while core inflation settled at 2.5%. Producer Price Index (PPI) data for July also came in flat, although the underlying measure excluding food, energy, and trade services saw a 0.4% increase. The final piece of the macro puzzle arrived on the morning of August 14, when retail sales reported a 0.6% decline—the first monthly drop in nine months.
In traditional finance, these figures were viewed as a green light for the Federal Reserve to consider interest rate cuts. Market odds for a September rate hike plummeted to 31%, down from 59% just one week prior. The S&P 500 responded by closing at a record high on August 13. Bitcoin, however, lagged behind its equity counterparts. The inability of the cryptocurrency to sustain a move through the $64,000 to $65,000 range, even as the U.S. dollar softened and yields stabilized, has raised concerns among analysts regarding the underlying strength of current buyer demand.
Analyzing the On-Chain Supply Wall and Holder Behavior
The primary obstacle to Bitcoin’s recovery appears to be a massive concentration of supply sitting just above current price levels. According to Bitfinex Alpha reports, approximately 1.79 million BTC—representing nearly 9% of the total circulating supply—was acquired within the $62,000 to $65,000 price band. This creates a "break-even" congestion zone where a significant portion of holders are incentivized to sell as soon as the price approaches their entry point, effectively capping any upward movement.
This behavior is further evidenced by the activity of long-term holders (LTHs). Supply held by this cohort fell by roughly 210,000 BTC from its July 29 peak. This represents the first weekly decline of 2026 and the most aggressive two-week distribution period since late 2024. Interestingly, the Long-Term Holder Spent Output Profit Ratio (SOPR) recorded values between 0.86 and 0.90 between August 9 and August 11. An SOPR below 1.0 indicates that coins are being moved at a loss. In this context, it suggests that "younger" long-term holders—those who likely entered the market during the peaks of $71,000 to $76,000—are realizing losses of 10% to 14% as they exit their positions into the current range.
While some cohorts are distributing, others appear to be accumulating. The number of wallets holding more than 1,000 BTC reached a 2026 high of 3.06 million BTC on August 8. This divergence suggests that while retail and mid-tier long-term holders may be capitulating or de-risking, "whales" are utilizing the range-bound price action to increase their positions. However, this accumulation has not yet been sufficient to offset the sell pressure originating from the break-even supply wall.
Institutional Flows and the Weekend Liquidity Gap
The institutional landscape for Bitcoin has also shown signs of cooling. U.S. spot Bitcoin ETFs recorded net outflows of approximately $289 million over the past week, reversing the positive momentum seen in early August. These ETFs now hold a combined $77.3 billion in net assets, which accounts for roughly 6.07% of Bitcoin’s total market capitalization.
The weekend presents a unique challenge for Bitcoin price stability. Because ETF trading is restricted to standard market hours, the "institutional channel" goes dark from Friday evening until Monday morning. This leaves the market’s price discovery entirely in the hands of crypto-native traders and offshore exchanges. Historically, lower liquidity during the weekend can lead to increased volatility, as smaller trade volumes can have a disproportionate impact on price movement. If the $62,500 floor is tested on a Saturday or Sunday, the lack of institutional "bid support" could lead to a sharper breakdown than would occur during a weekday.
Geopolitical Risks and the Strait of Hormuz Incident
Adding to the complexity of the weekend setup is a brewing geopolitical crisis in the Middle East. On August 14, the United Arab Emirates accused Iran of attacking two vessels belonging to the Abu Dhabi National Oil Company (ADNOC) in the Strait of Hormuz. While no injuries were reported, the incident has reignited fears regarding the security of a waterway that handles approximately 20% of the world’s oil and liquefied natural gas (LNG) shipments.
Brent crude prices reacted by climbing toward $88.50 per barrel. For Bitcoin, geopolitical instability often acts as a double-edged sword. While it is sometimes touted as "digital gold" or a safe-haven asset, in the immediate aftermath of a conflict escalation, it frequently trades as a high-beta risk asset. Furthermore, because Bitcoin is the only major asset that trades 24/7, it often serves as a "front-run" for global risk sentiment. Any further escalation in the Strait of Hormuz over the weekend would likely be reflected in Bitcoin’s price long before traditional stock or commodity markets reopen on Monday.
Technical Scenarios: The Path Forward for Bitcoin
As the market heads into the weekend, analysts are monitoring three primary scenarios based on the established support and resistance levels.
The Base Case: Continued Range Consolidation
In the base-case scenario, Bitcoin continues to "chop" within the $62,500 to $64,500 range. This would involve repeated tests of the floor followed by weak bounces that fail to clear the $65,000 resistance. This outcome would suggest that while native demand is sufficient to prevent a total collapse, there is not yet enough conviction to overcome the supply wall of underwater holders.
The Bull Case: The Failed Breakdown and Reclaim
A bullish outcome would involve a "liquidity grab" where the price briefly wicks below the $62,500 support to trigger stop-loss orders, followed by a rapid recovery above $63,500. If Bitcoin can then sustain a move through the $64,500 to $65,500 zone—the area that has rejected it six times—it would signal that the supply wall has been absorbed. This would open the door for a recovery toward the $66,000 to $68,700 extension zone, shifting the market structure from defensive to recovery.
The Bear Case: The Liquidity Break
The bearish scenario involves a sustained trade below $62,500. In the absence of weekend ETF support, a failure at this level could accelerate quickly. The first psychological destination for sellers would be the $60,000 mark. If $60,000 fails to hold, the next major structural support zone sits between $58,000 and $59,000. A move of this magnitude would likely be triggered by a combination of disappointing on-chain data and a "risk-off" sentiment driven by geopolitical news.
Conclusion and Market Implications
Bitcoin finds itself at a crossroads where macroeconomic tailwinds are being neutralized by heavy on-chain supply and institutional hesitation. The asset has already received the "relief" it needed from cooling inflation and a softening labor market, yet it remains pinned below its resistance ceiling.
The coming 48 hours will serve as a purity test for crypto-native demand. If the $62,500 floor holds through the weekend without the assistance of Wall Street’s ETF inflows, it would demonstrate a level of structural resilience that could set the stage for a September rally. Conversely, if the thin liquidity of the weekend leads to a breakdown, it may indicate that the "macro relief" narrative is not enough to overcome the reality of a market still saturated with sellers looking to exit at break-even prices. For now, Bitcoin remains a prisoner of its own range, waiting for a catalyst strong enough to break the deadlock.