Bitcoin (BTC) experienced a notable decline on Thursday, slipping below the $69,000 threshold and returning to a familiar six-week consolidation range just days after it reached for range highs above $76,000. This price action marks a significant cooling period following a period of intense volatility and bullish optimism. The current pullback appears to be driven by a confluence of factors, including a surge in selling pressure within the Bitcoin futures markets and a visible deceleration in demand from United States-based investors. Despite this immediate downward trajectory, technical analysts suggest that the underlying market structure remains complex, with a recurring chart setup indicating that a rebound rally could materialize if specific support levels are successfully defended.
The Shift in Market Dynamics: Derivatives Over Spot Activity
The recent downward movement in Bitcoin’s price has been characterized by a distinct shift in the balance between spot market demand and derivatives activity. For much of the previous week, spot buying—particularly from US-based institutions and retail investors—had been the primary engine driving prices toward the $76,000 mark. However, recent data suggests that this spot-led momentum has stalled. The Coinbase premium gap, a metric that measures the price difference between Bitcoin on Coinbase (largely used by US traders) and global exchanges like Binance, has turned negative. This shift indicates that demand from US-based investors is no longer leading the market, suggesting a period of distribution or waning interest at higher price levels.

According to data provided by crypto analyst IT Tech, there is currently a clear imbalance between spot markets and perpetual futures. The cumulative volume delta (CVD), which tracks the net difference between buying and selling volume, revealed that spot CVD fell by approximately $40.64 million. In contrast, the perpetual futures CVD plummeted by $506.75 million. This massive discrepancy highlights that the current selling pressure is being driven primarily by leveraged traders in the derivatives market rather than a mass exodus of spot holders. While the spot market shows signs of cooling, the aggressive selling in the futures market suggests a "flush out" of long positions.
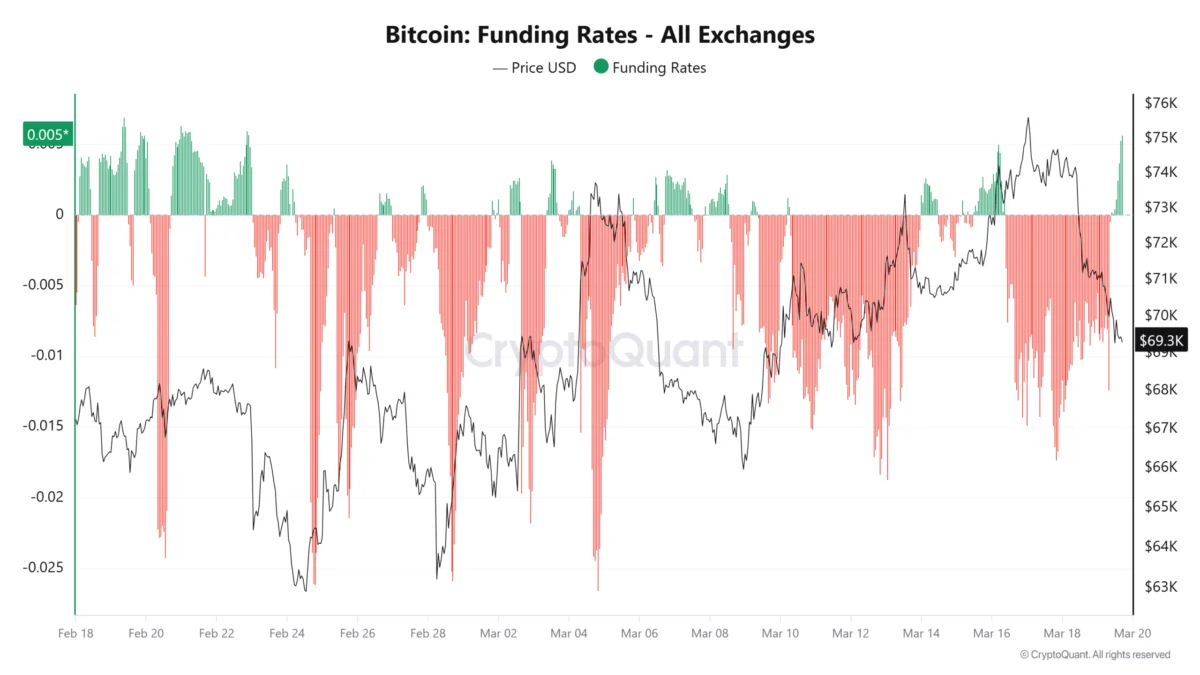
Furthermore, the Bitcoin funding rate has transitioned to a positive 0.05%. In the context of perpetual futures, a positive funding rate means that traders holding long positions are paying a fee to those holding short positions. This typically indicates a prevailing long bias among derivatives traders, but it also creates a situation where the market becomes "top-heavy." When funding rates are high, the cost of maintaining long positions increases, often leading to a cascade of liquidations if the price fails to move higher, which appears to be the case in the current $69,000 retracement.
Chronology of the Recent Price Action
To understand the current market position, it is essential to trace the trajectory of Bitcoin over the past several trading sessions. Following a period of relative stability in early October, Bitcoin began a steady ascent, fueled by positive sentiment regarding institutional adoption and anticipation of favorable macroeconomic shifts.

- The Ascent to $76,000: In late October, Bitcoin broke out of its mid-range consolidation, tapping highs above $76,000. This move was characterized by strong spot inflows and a positive Coinbase premium, signaling robust US participation.
- The Consolidation Phase: Upon reaching the $76,000 level, the asset encountered significant resistance. Profit-taking ensued, and the price began to move sideways as bulls and bears battled for control over the $73,000 to $75,000 zone.
- The Thursday Retraction: By Thursday, the failure to sustain levels above $72,000 led to a breakdown. The price slipped through the $70,000 psychological support level, eventually bottoming out below $69,000.
- The Current Stabilization: As of the latest trading data, Bitcoin is attempting to find a floor near the $68,500 to $69,000 region. Order book data indicates that bid-side support is beginning to cluster around $70,000, suggesting that buyers are stepping back in to defend the lower boundary of the current range.
Technical Analysis: The Bullish Fractal and RSI Divergence
Despite the immediate bearish optics of a sub-$69,000 price point, technical analysts have identified a "fractal" setup that mirrors a successful recovery observed earlier this year. Specifically, the current price action on lower timeframes bears a striking resemblance to the correction that occurred between March 6 and March 8. During that period, Bitcoin underwent a sharp decline that swept internal liquidity levels—essentially cleaning out stop-loss orders—before reversing sharply to print new highs.
The current move follows a similar sequence of successive lower lows, which many analysts interpret as a potential exhaustion phase for sellers. A critical component of this bullish thesis is the Relative Strength Index (RSI). In the March recovery, the price reversal was preceded by a bullish divergence on the RSI. This occurs when the price prints a lower low while the RSI prints an equal or higher low, signaling that the downward momentum is losing its strength despite the falling price. A comparable divergence is currently developing on the four-hour and hourly charts, reinforcing the possibility of a "spring" move upward.
Liquidity data further supports this outlook. The recent dip has resulted in significant long-side liquidations, effectively reducing the "open interest" in the market. By flushing out overleveraged participants, the market becomes "lighter," making it easier for a smaller amount of buying volume to move the price higher. If Bitcoin can swiftly reclaim the $70,000 level, it would align with the previous fractal recovery path, potentially opening the door for a retest of $76,000.

Key Support and Resistance Levels to Watch
As the market navigates this period of uncertainty, several price levels have emerged as critical pivots for Bitcoin’s short-term trajectory:
- $73,000 (The Institutional Base): Trading Stables founder Ryan Scott has identified $73,000 as a vital level for market stability. Failure to maintain or reclaim this level suggests a weak response from buyers, which could increase the probability of a deeper correction toward range lows.
- $72,000 (The Pivot Zone): This level acts as a key psychological and technical pivot. A reclaim of $72,000 could trigger a "short squeeze," as traders who entered short positions near $69,000 find themselves underwater and are forced to buy back their positions.
- $70,000 (Psychological Support): The $70,000 mark remains the immediate battleground. Order book depth shows significant interest from buyers in this region, serving as a buffer against further declines.
- $68,300 (The Line in the Sand): A decisive breakdown below $68,300 would invalidate the current bullish fractal. Such a move would shift the market’s focus toward higher-timeframe liquidity zones sitting at $65,000 and $62,000.
Institutional Sentiment and Broader Market Implications
The cooling of the Coinbase premium gap raises questions about the current state of institutional appetite. Throughout the first half of 2024, US-based Spot Bitcoin ETFs (Exchange-Traded Funds) were a primary driver of price appreciation. However, as the market enters the final quarter of the year, the "ETF effect" appears to have reached a state of equilibrium. While inflows remain net positive over longer durations, the day-to-day volatility suggests that institutional players are becoming more price-sensitive, opting to wait for retracements rather than chasing breakouts above $75,000.
Furthermore, the broader cryptocurrency ecosystem is watching Bitcoin’s performance as a bellwether for "Altseason." Typically, a period of Bitcoin consolidation—provided it maintains its support levels—allows capital to flow into Ethereum and other high-cap altcoins. However, if Bitcoin undergoes a violent breakdown below $68,000, it is likely to drag the broader market down with it, as liquidity is sucked back into the primary asset or exited into stablecoins.

Conclusion and Outlook
The decline of Bitcoin below $69,000 represents a classic market "reset," where the exuberance of a new high is met with the reality of profit-taking and leveraged liquidations. While the negative Coinbase premium and the drop in spot demand are concerns for those looking for an immediate moonshot, the technical structure provides a more nuanced picture. The development of an RSI divergence and the similarity to the March fractal suggest that the current "exhaustion phase" may be a precursor to another leg up.
However, the market remains highly sensitive to time and specific price levels. The coming days will be crucial in determining whether the $68,300 support holds. If the bulls can successfully defend this zone and reclaim the $70,000 to $72,000 range, the path to $76,000 remains open. Conversely, a failure to stabilize will likely see Bitcoin revisit the lower bounds of its multi-month range, testing the resolve of long-term holders at the $62,000 to $65,000 levels. As always, the interplay between the high-leverage derivatives market and the steady hand of spot buyers will dictate the next major trend for the world’s largest digital asset.