James Watt
The digital asset market reached a significant milestone this week as Bitcoin surged past the $66,000 mark for the first time since early June, signaling a potential reversal of the bearish trend that characterized much of the early summer. While the nominal price recovery suggests a return to bullish sentiment, underlying on-chain data and market participation metrics reveal a more complex and fragile landscape. This recent appreciation is currently serving as a litmus test for market stability, as investors navigate a terrain marked by substantial realized losses, thin trading volumes, and a cautious derivatives sector.
According to the latest "Chaincheck" report from VanEck, the current rebound is emerging from a position of historical weakness. Despite the price recovery, the network’s overall health remains under pressure from the recent downturn. Data indicates that investors who exited their positions over the past month realized significantly higher losses than gains, suggesting a period of intense "capitulation" among shorter-term participants. Furthermore, unrealized losses across the Bitcoin network currently represent approximately 16% of the total market capitalization, a figure that highlights the lingering financial "scar tissue" left by the price volatility of late June and early July.
Profitability Metrics and the Search for a Market Floor
A critical gauge of market health is the percentage of the circulating supply currently held in profit. In a robust bull market, this figure typically hovers well above historical norms. However, VanEck’s research shows that only 53% of Bitcoin’s circulating supply was sitting in profit during the initial stages of this climb. This is notably lower than the four-year average of 76%, indicating that nearly half of all existing Bitcoin was last moved at prices higher than the current market value.
The move above $66,000 is a pivotal moment for these "underwater" holders. Market analysts are closely watching to see if the price can sustain these levels long enough to convert these unrealized losses into gains, thereby reducing the pressure on investors to sell at break-even points. The current discrepancy between the price and the percentage of supply in profit suggests that while the "headline price" looks favorable, the average investor’s portfolio is still in a recovery phase rather than a growth phase.
A Chronology of the Recent Market Downturn
To understand the significance of the $66,000 breach, one must look at the sequence of events that led to the mid-summer slump. In early June, Bitcoin was trading near its all-time highs, buoyed by consistent inflows into US-based spot ETFs and optimism regarding Federal Reserve interest rate cuts. However, the market faced a "triple threat" of selling pressure in late June and early July:

- Government Liquidations: The German Federal Criminal Police Office (BKA) began a massive liquidation of approximately 50,000 BTC seized from an illegal movie streaming site. This sudden influx of supply created a "liquidity vacuum" that depressed prices toward the $54,000 level.
- Mt. Gox Distributions: After a decade of legal proceedings, the trustees of the defunct Mt. Gox exchange began the process of returning billions of dollars worth of Bitcoin to creditors. The fear of these long-term holders dumping their coins on the market led to a preemptive sell-off.
- Mining Pressure: Following the April halving event, which saw miner rewards cut in half, many mining operations faced diminished profitability. This led to "miner capitulation," where smaller operations were forced to sell their holdings to cover operational costs.
The recovery to $66,000 represents the market’s attempt to absorb this massive supply overhang. While the German government has completed its sales and the Mt. Gox distribution is being gradually integrated, the "supply shock" has left the spot market hesitant.
The Challenge of Thin Spot Market Liquidity
One of the most concerning aspects of the current rally is the lack of broad-based participation in the spot market. For a price breakout to be considered sustainable, it typically requires a corresponding surge in trading volume, indicating that a large number of buyers are "voting" for the higher price with their capital.
VanEck data reveals that average daily spot volume over the past 30 days has hovered around $5.1 billion. This is roughly 29% below the $7.2 billion average recorded since 2019. This "thinness" in the market means that prices can be moved more easily by smaller trades, leading to increased volatility and a higher risk of "fake-out" rallies.
Furthermore, the order flow remains skewed toward sellers. Even as the price rose, market orders from sellers exceeded buying orders by an average of $70 million per day over the past month. While this imbalance narrowed to $59 million in the most recent week, it remains significantly higher than the historical average of $21 million. This suggests that the current price increase may be driven more by a temporary exhaustion of sellers rather than a decisive return of aggressive buyers.
Derivatives Market: Hedging Against the Downside
The caution observed in the spot market is mirrored—and perhaps magnified—in the derivatives landscape. Traders are currently paying a significant premium to protect their portfolios against another sudden drop, a behavior known as "downside hedging."
The put-to-call premium ratio, which compares the cost of options that bet on a price decrease versus those that bet on an increase, recently hit 1.49. According to historical data, this level of extreme defensive positioning has occurred only about 10% of the time since 2021. This indicates that while traders are participating in the rally, they are doing so with a "safety net" in place, reflecting a lack of conviction in the long-term stability of the $66,000 level.
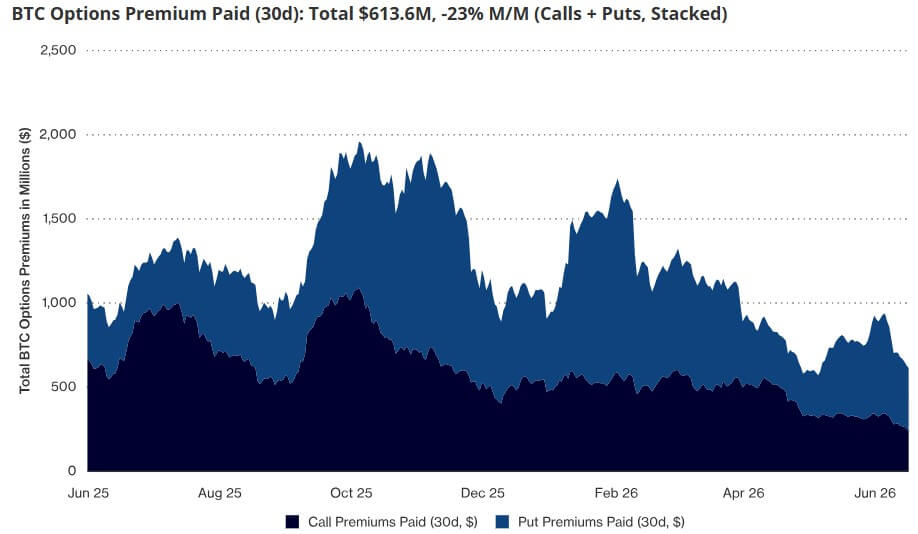
In the futures market, open interest—the total number of outstanding contracts—fell to $29.4 billion from a peak of $35.7 billion two months ago. While funding rates (the cost of holding a bullish position) remain positive, they are well below the levels typically seen during a full-scale bull run. This lower leverage is a double-edged sword: it suggests that the market is not "overheated," which reduces the risk of a massive liquidation event, but it also shows that the "speculative fire" that often drives rapid price appreciation is currently muted.
Long-Term Holders and the "Illiquid" Supply Wall
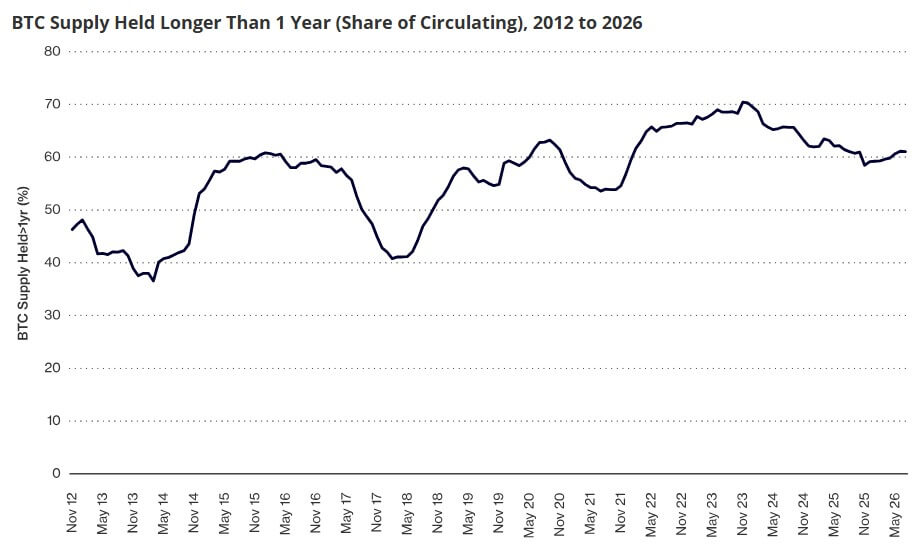
Despite the apprehension among active traders, the backbone of the Bitcoin network—the long-term holders (LTHs)—remains remarkably steadfast. VanEck’s analysis shows that approximately 12.2 million BTC, or 60.8% of the total circulating supply, has not moved in more than a year. This is an increase from 59.1% just six months ago.
When expanding the window to six months, roughly 78.5% of the supply remains untouched. This "HODLing" behavior effectively removes a vast majority of Bitcoin from the active trading pool, creating a "supply crunch" that can amplify the impact of any new demand. Historically, periods where more than 60% of the supply is dormant while prices are rising have been precursors to significant bull markets.
However, there are subtle signs of movement. Exchange balances increased by over 26,000 BTC in the last month, and some coins held for three to ten years have begun to move. If these "ancient" coins are being moved to exchanges to be sold, it could provide the necessary liquidity for buyers but also cap the potential for further price gains in the short term.
Institutional Demand: The Return of the ETF Engine
A significant driver behind the move to $66,000 has been the renewed appetite from institutional investors via US-based spot Bitcoin ETFs. After a period of stagnation where these products saw net outflows of approximately 40,010 BTC (worth $2.4 billion), the tide has turned.
Recently, US spot Bitcoin ETFs recorded six consecutive days of net inflows, totaling more than $930 million. This represents the longest positive streak since early May. These inflows are crucial because they represent "sticky" capital from traditional finance (TradFi) investors who are often less reactive to short-term volatility than crypto-native retail traders.
This institutional demand is being supplemented by corporate treasuries and miners. MicroStrategy, led by Michael Saylor, added 2,343 BTC to its holdings during this period, while miners retained 1,204 BTC, slowing their recent selling trend. This alignment of institutional and corporate buying, combined with the restricted supply from long-term holders, explains how Bitcoin was able to overcome the "seller-heavy" spot market to breach the $66,000 mark.
Broader Implications and the August Liquidity Test
As the market enters the late summer months, several macroeconomic factors are converging that could determine the fate of the current rally. The US national debt recently surpassed $39.5 trillion, a figure that many analysts believe strengthens the "digital gold" narrative for Bitcoin as a hedge against currency debasement.
However, the "August liquidity test" looms. Historically, August is a month of lower trading activity across all financial markets as participants take summer holidays. In a market already characterized by thin volumes, any sudden shift in demand or a surprise macroeconomic event—such as a shift in Federal Reserve policy or geopolitical tension—could have an outsized impact on Bitcoin’s price.
The ultimate signal for the next phase of the market will be the return of the "ordinary" spot buyer. If the breach of $66,000 can attract retail and mid-tier investors who have been sitting on the sidelines, the market could see the volume increase necessary to solidify the current gains. Conversely, if trading remains thin and derivatives traders continue to favor downside protection, the $66,000 level may act as a temporary ceiling rather than a new floor.
In conclusion, while the headline price of Bitcoin suggests a triumphant return to form, the underlying data reveals a market that is still healing. The interplay between institutional ETF inflows, the resilience of long-term holders, and the cautiousness of derivatives traders creates a complex environment where the next major move will likely depend on whether "real" demand can finally outweigh the lingering desire of participants to exit at break-even prices.