James Watt
The global cryptocurrency market reached a pivotal turning point over the last 24 hours as Bitcoin (BTC) surged past the $86,000 mark, effectively neutralizing a massive pocket of bearish leverage that had constrained the asset’s price action for months. The largest digital asset by market capitalization climbed as high as $87,363, marking its most robust performance since January and signaling a definitive shift in market structure. While the price eased slightly to $85,824 at press time, according to CryptoSlate data, the momentum generated by this breakout has firmly placed the psychological $90,000 threshold within the sights of institutional and retail traders alike.
This recent price action represents more than just a numerical milestone; it signifies the conclusion of a prolonged period of consolidation. The advance pushed Bitcoin through a stubborn resistance zone that had repeatedly capped previous rallies, leading to an accumulation of significant short positions. As these bearish bets were systematically dismantled, the resulting "short squeeze" provided the mechanical fuel necessary to propel the asset into new territory.
A Technical Rebirth: Reclaiming Long-Term Moving Averages
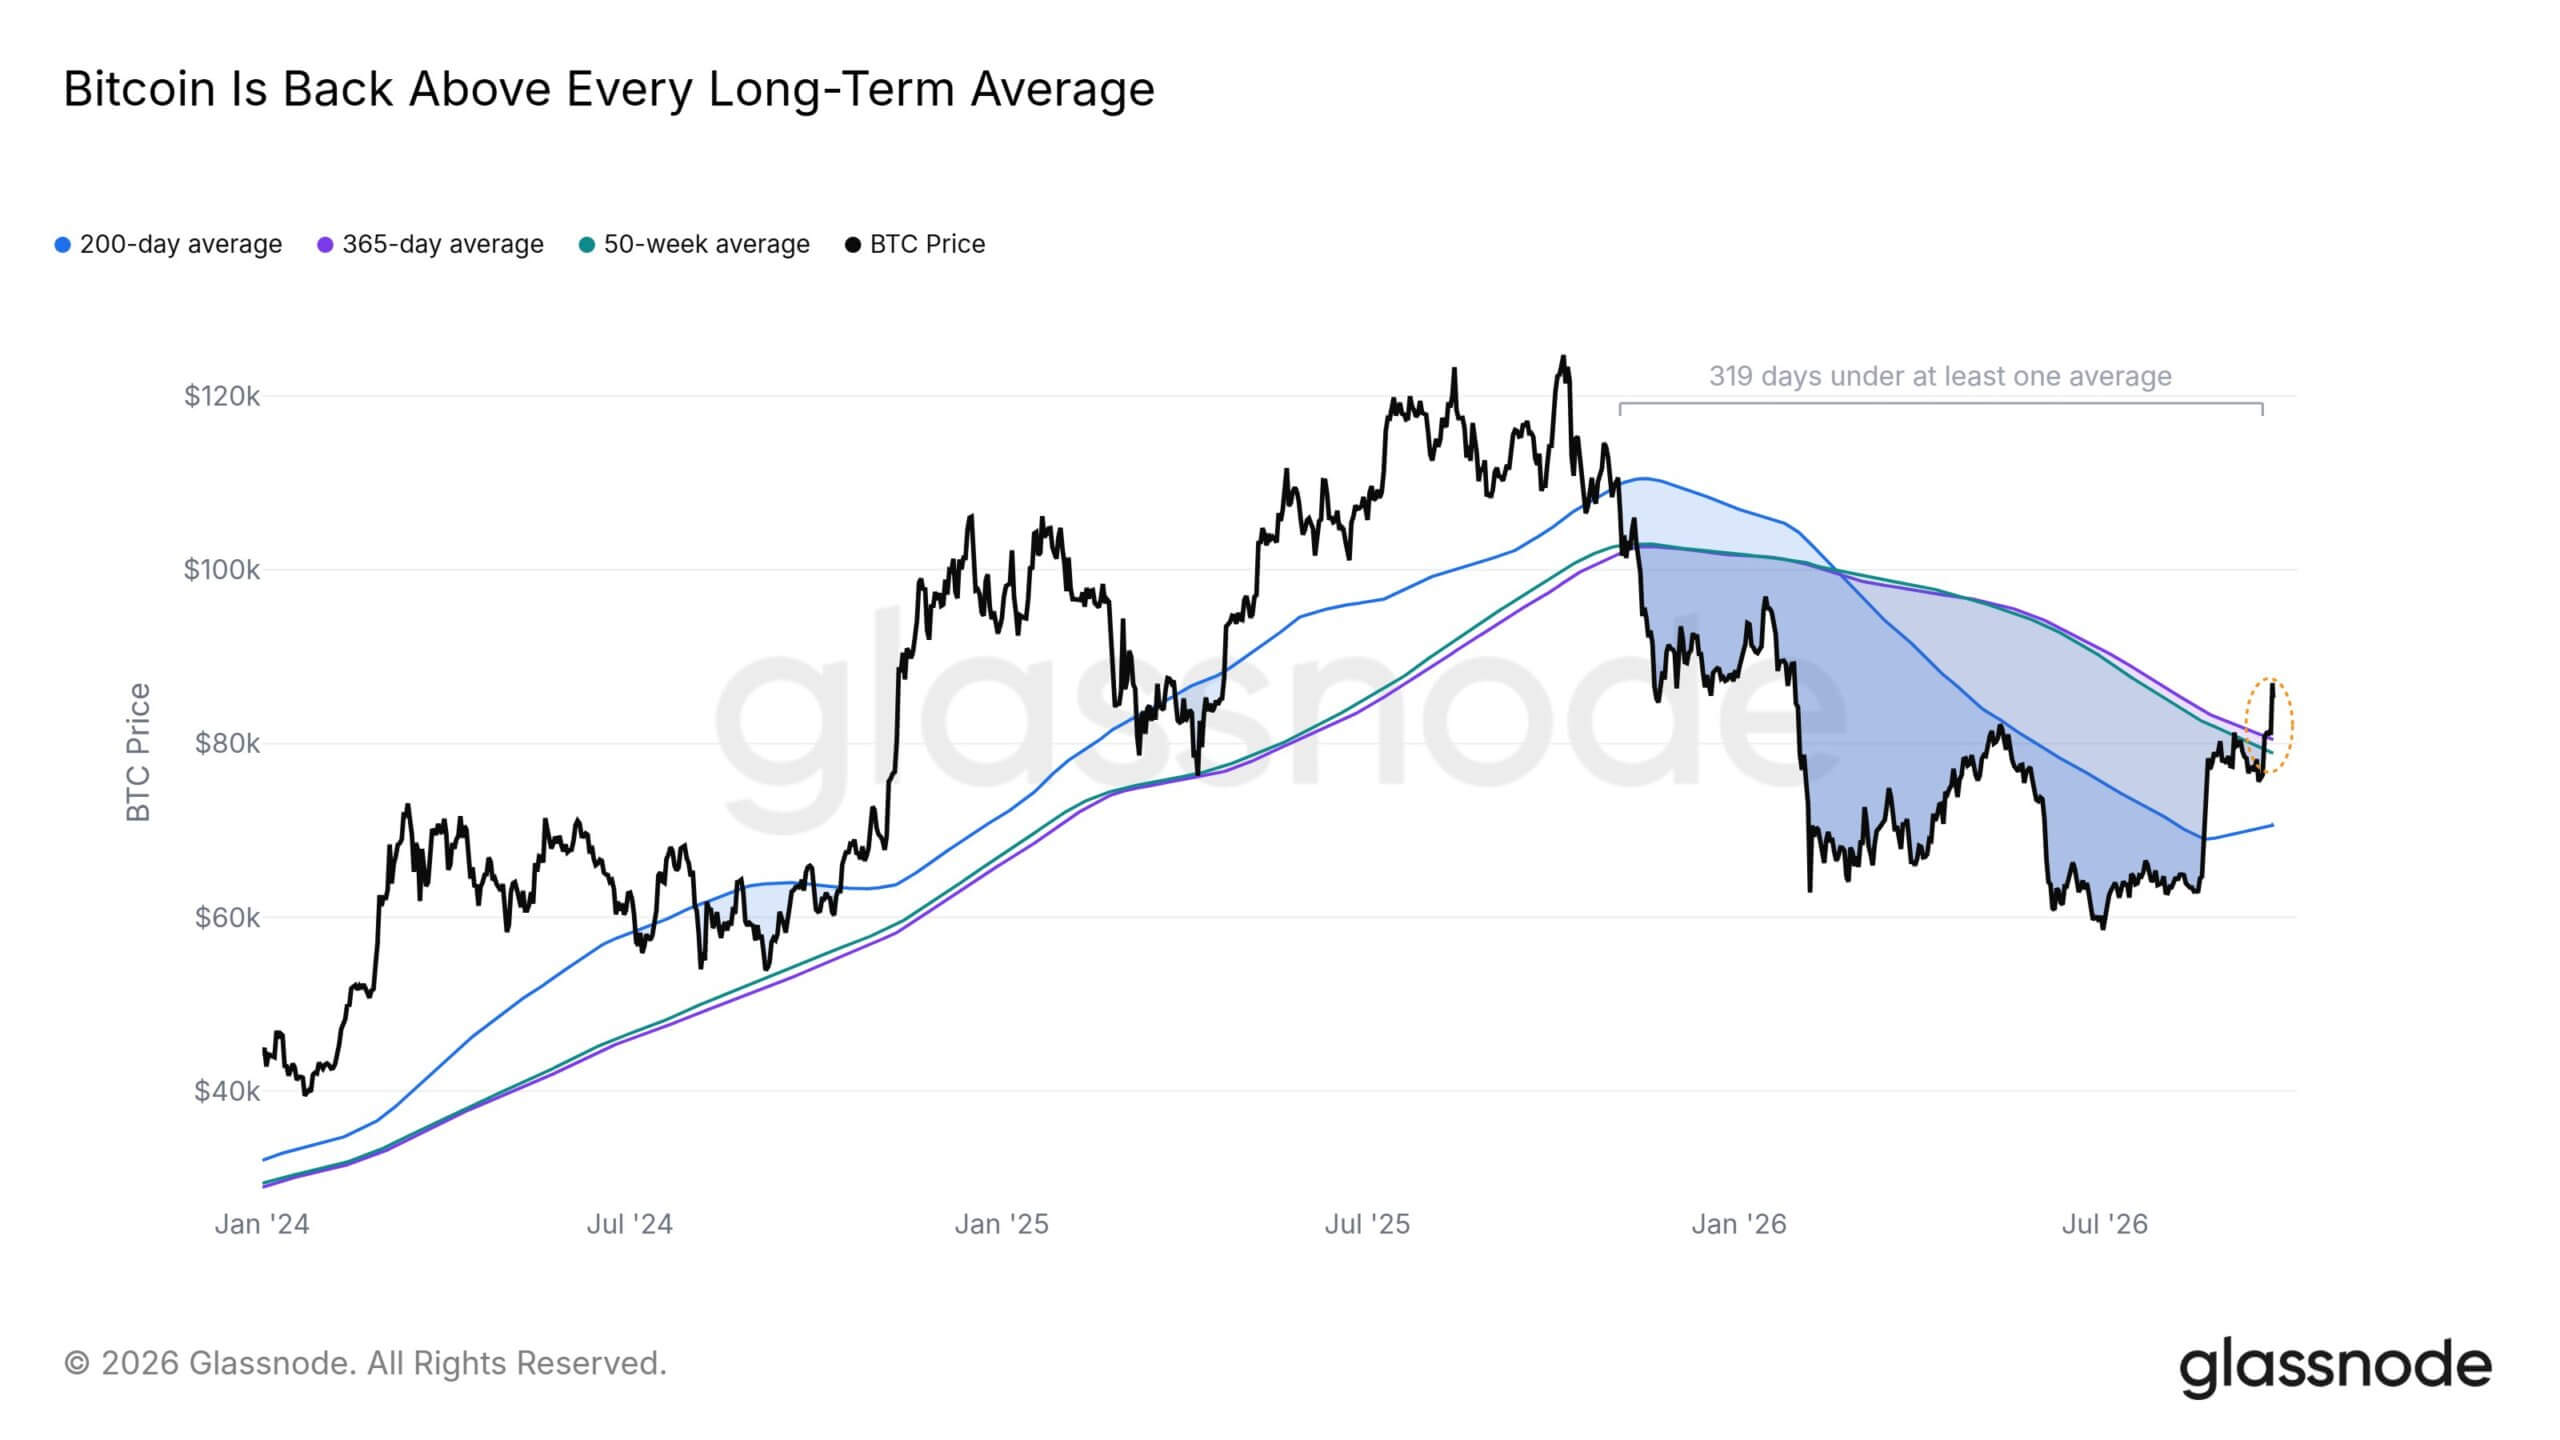
The significance of the move above $86,000 is underscored by the reclamation of several critical technical indicators. According to data provided by Glassnode, Bitcoin has successfully reclaimed all of its major long-term moving averages (MAs). This achievement is particularly noteworthy because the asset had spent approximately 300 days trading below these levels, a period characterized by uncertainty and range-bound volatility.
In technical analysis, long-term moving averages, such as the 200-day and 111-day MAs, serve as a barometer for the overall health of a market. Trading above these levels typically distinguishes a sustained "bullish regime" from a "weak market structure." Furthermore, Glassnode reported that Bitcoin is now trading comfortably above its True Market Mean and the short-term holder cost basis. The True Market Mean is a metric used to identify the average price at which all market participants acquired their holdings, adjusted for lost or dormant coins. By moving above this level, the market has transitioned from a state of unrealized loss for the average investor to a state of widespread profitability.
The short-term holder cost basis, which tracks the average entry price of investors who have held Bitcoin for less than 155 days, currently acts as a dynamic support level. In previous bull cycles, remaining above this cost basis has been a prerequisite for continued upward momentum. The fact that Bitcoin has cleared these hurdles simultaneously suggests that the current rally is backed by a more robust foundation than the fleeting spikes seen earlier in the year.

Chronology of the Breakout: From Resistance to Support
The path to $87,000 was not a linear ascent but rather a strategic battle between bulls and bears that played out over several months. To understand the current market position, one must look at the timeline of events leading up to this week’s volatility.
- The Accumulation Phase (Mid-2025): Following the peak in October 2025, Bitcoin entered a cooling-off period. During this time, the $82,000 to $86,000 range emerged as a formidable ceiling. Each attempt to breach this level was met with heavy selling pressure, encouraging traders to build "short" exposure—betting that the price would continue to fail at these levels.
- The Consolidation Trap: For nearly 300 days, Bitcoin oscillated below its long-term moving averages. This created a sense of complacency among bears, who viewed the $86,000 level as a "durable resistance."
- The Initial Breakout (Past 48 Hours): As fresh demand began to trickle into the market, Bitcoin tested the $84,000 level. Unlike previous attempts, the selling pressure did not immediately drive the price back down.
- The Liquidation Event: Once the price crossed $86,000, a cascade of automated "stop-loss" orders for short positions was triggered. This forced bears to buy back Bitcoin at market prices to close their losing positions, creating a feedback loop of buying pressure that spiked the price to the $87,363 intraday high.
The Magnitude of Liquidations and Leverage Shifts
The velocity of the move through $86,000 was largely a byproduct of the derivative market’s positioning. Data from CoinGlass reveals that more than $1 billion in short positions were liquidated during the breakout. This massive "flush" cleared out the bearish leverage that had been acting as a drag on the market.
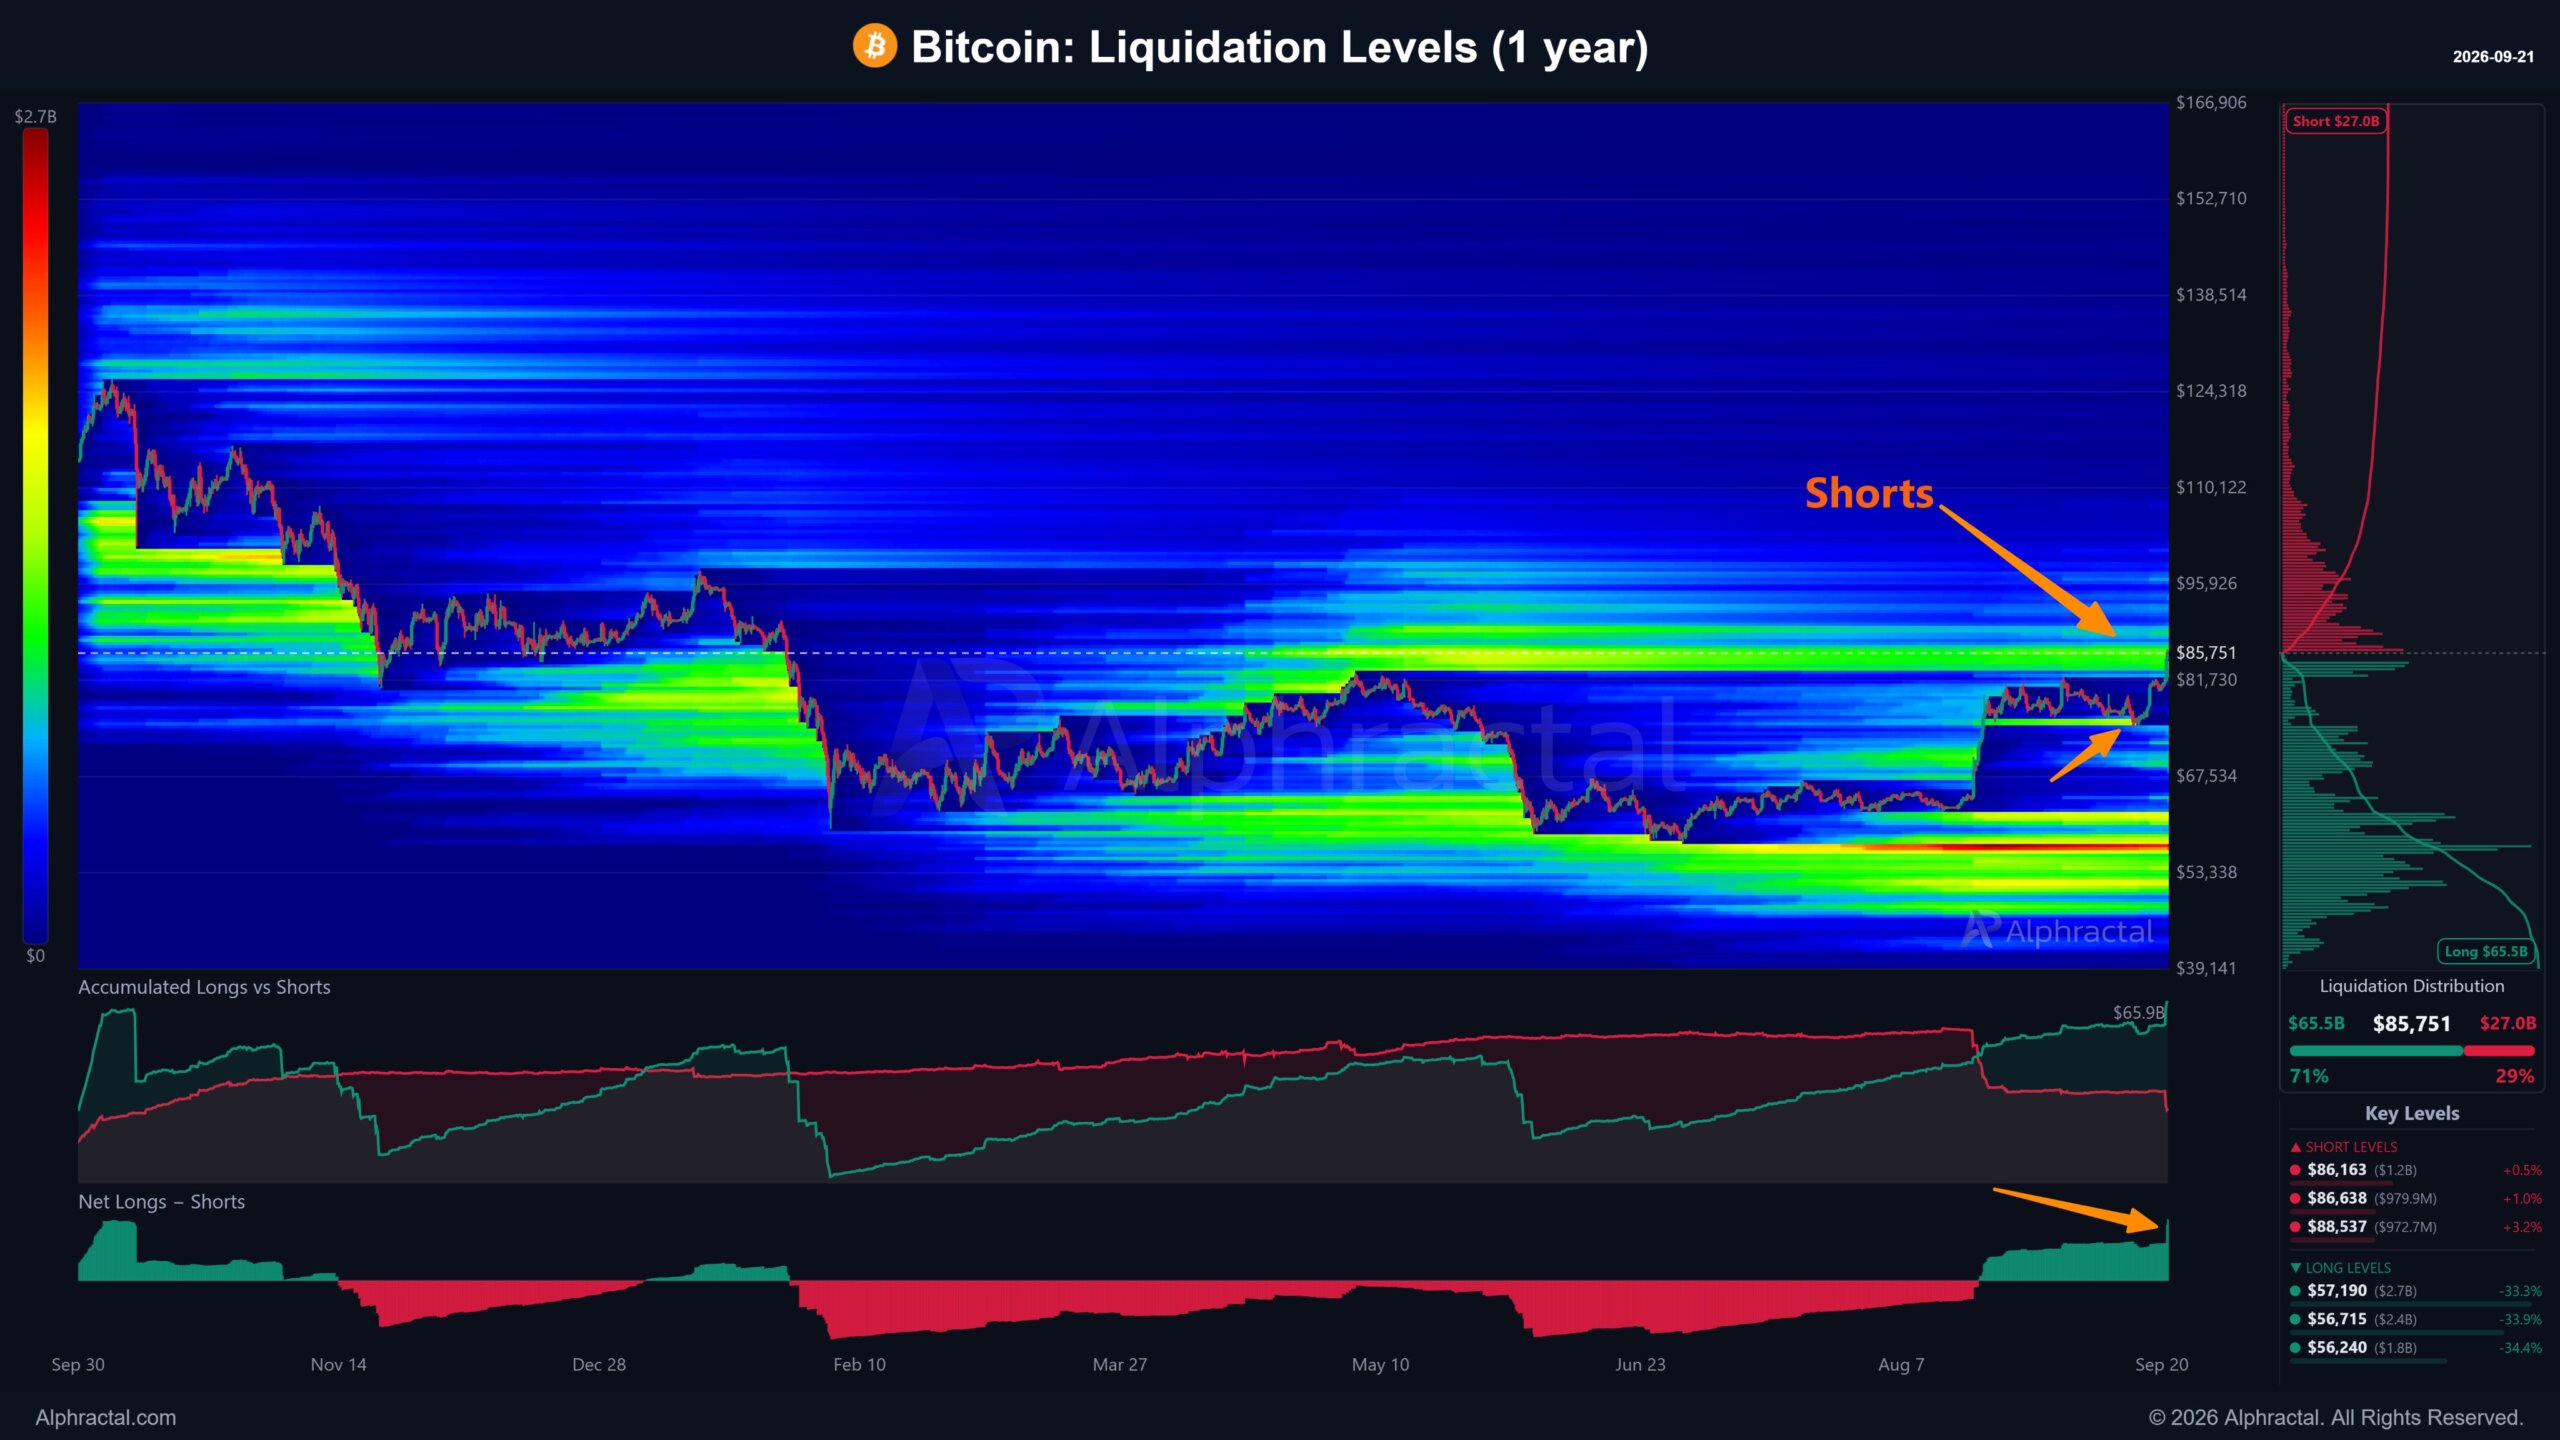
Joao Wedson, Chief Executive of Alphractal, noted that the rally reached the largest short-liquidation zone built over the past calendar year. Wedson explained that this move followed an earlier washout of leveraged "long" positions during a prior decline, meaning the market has undergone a total reset in positioning.
However, this reset has now tilted the risk in the opposite direction. Alphractal’s current estimates suggest that "long" positions now account for approximately 71% of remaining unliquidated positions, while "shorts" make up only 29%. This is one of the widest gaps in leverage since the record highs of October 2025. While this reflects high confidence among bulls, it also introduces a new risk: a "long squeeze." If the price fails to find immediate follow-through demand, the high concentration of leveraged longs could lead to a sharp pullback if those traders are forced to sell.
Despite this tilt toward long leverage, Glassnode analysts pointed out that the market is not yet at the "speculative extremes" seen in previous cycle peaks. Perpetual-futures funding rates—the cost of holding a long position—remain below neutral levels, suggesting that the current move is driven more by spot market buying and necessary liquidations rather than reckless over-leveraging.
On-Chain Activity Hits Four-Year Highs
Supporting the price action is a dramatic increase in on-chain transaction volume. Bitview data indicates that more than 1 million BTC, valued at over $92 billion, moved across the network during the past week. This represents the highest transaction volume recorded in four years, even surpassing the activity seen during the major market peak in October 2025.
High transaction volume during a price breakout is generally viewed as a positive sign by analysts, as it suggests that the price move is being supported by actual utility and transfer of value rather than just exchange-based speculation. This level of activity implies that institutional "whales" and large-scale investors are rebalancing their portfolios or entering new positions at these elevated levels.
Options Market Targets: The $90,000 Magnet
As the spot market stabilizes above $85,000, attention has shifted to the options market to gauge where traders believe the next ceiling lies. Data from Deribit, the world’s largest crypto options exchange, shows a significant concentration of "Open Interest" (OI) at several key strike prices:
- $90,000 Strike: Approximately $2.7 billion in open interest.
- $95,000 Strike: Approximately $2.7 billion in open interest.
- $100,000 Strike: Approximately $2.3 billion in open interest.
In total, nearly $7.7 billion of exposure is clustered between $90,000 and $100,000. These figures represent both "calls" (bets that the price will rise) and "puts" (bets that the price will fall or hedges against a drop). The concentration of risk at the $90,000 level makes it the immediate psychological and technical reference point for the market.
With Bitcoin needing less than a 5% gain from current levels to hit $90,000, the "gamma" associated with these options could act as a magnet, pulling the price toward that strike as the expiration dates for these contracts approach.
Sentiment Analysis: From Fear to Extreme Greed
The shift in price has been accompanied by an equally dramatic shift in market psychology. Blockchain analysis firm Santiment reported that bullish social media discussion surrounding Bitcoin has reached its highest level since early 2024. Simultaneously, the Crypto Fear and Greed Index has moved into the "Extreme Greed" territory.
While "Extreme Greed" is often a contrarian signal that the market may be overextended in the short term, it also reflects the return of retail interest. For much of the past year, the market was dominated by institutional players and automated trading bots. The return of high-sentiment retail discussion suggests that the broader public is once again beginning to pay attention to the asset’s performance.
Broader Impact and Market Implications
The breakout above $86,000 has fundamental implications for the broader cryptocurrency ecosystem. First, it validates the "buy the dip" mentality that has been prevalent among long-term holders (LTHs) throughout the 300-day consolidation period. By reclaiming major moving averages, Bitcoin has signaled to the investment community that the macro uptrend remains intact.
Second, the clearing of the $86,000 resistance zone changes the "path of least resistance." For months, the path of least resistance was downward or sideways due to the heavy overhead supply of short positions. Now that those positions have been "flushed," the market is in a "price discovery" phase where the absence of established resistance levels could lead to more volatile upward moves.
However, the next leg of the rally will require a different catalyst. The move from $82,000 to $87,000 was largely mechanical—fueled by the closing of shorts. To move from $87,000 through $90,000 and toward $100,000, the market will need a sustained influx of fresh capital. This demand must be strong enough to absorb the profit-taking that naturally occurs as investors reach major milestones.
The fragility of the current setup lies in the lopsided leverage ratio. With 71% of the market now positioned for further gains, any unexpected negative news or a failure to breach $90,000 could lead to a rapid deleveraging event. Investors are no longer asking if Bitcoin can escape its old range; they are now betting on how far the breakout can run. As the asset approaches the six-figure territory, the margin for error becomes thinner, and the stakes for the next $3,000 move become significantly higher.