James Watt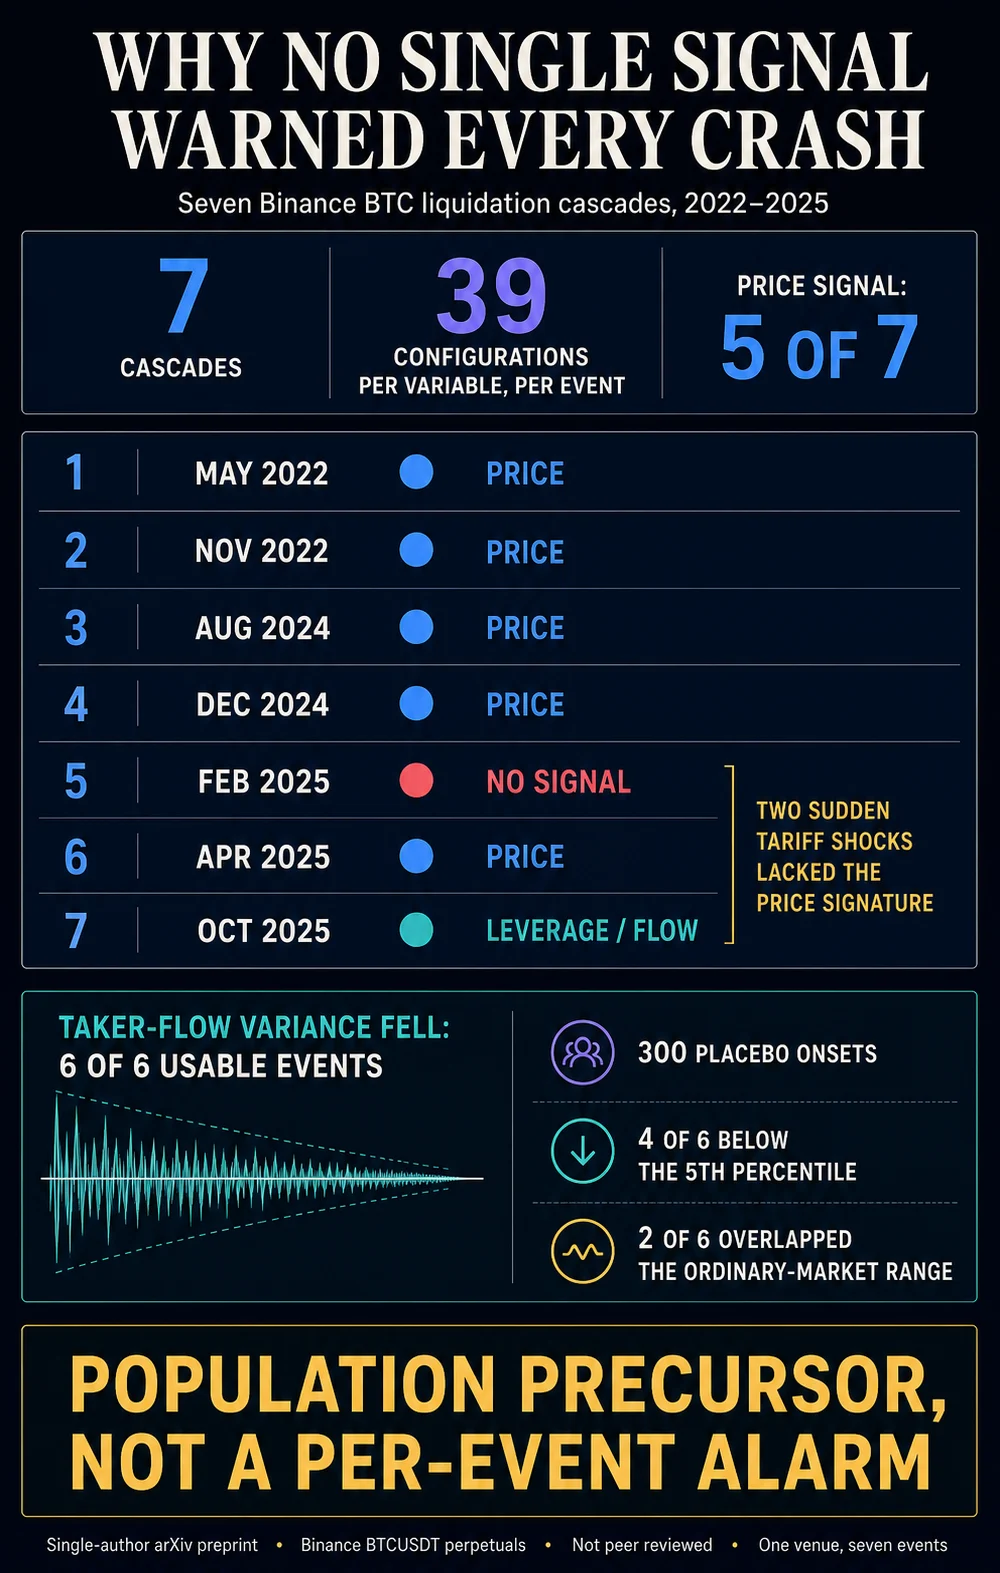
The Theoretical Framework of Critical Slowing Down
At the heart of the study is the concept of "Critical Slowing Down" (CSD), a phenomenon observed in complex dynamical systems ranging from climate patterns to ecological shifts. In financial terms, CSD suggests that as a market approaches a "tipping point"—such as a massive liquidation event—it loses its resilience and takes longer to recover from small shocks. This lack of resilience typically manifests in two ways: increased variance (higher volatility) and increased lag-1 autocorrelation (the tendency for current price movements to be highly correlated with immediately preceding ones).
Seuma’s research applied this framework to 39 different combinations of analysis windows for every variable across the seven identified events. The methodology utilized one-minute price bars and five-minute intervals for open interest, trader positioning, and taker buy/sell data. By using rolling variance and autocorrelation on detrended residuals, the study attempted to isolate the signals that preceded the catastrophic "cascades"—moments where a drop in price triggers automatic sell orders for leveraged positions, which in turn drives the price lower in a self-reinforcing loop.
Chronology of Analyzed Liquidation Events (2022–2025)
The study’s dataset covers a transformative period in Bitcoin’s history, encompassing both the depths of the 2022 bear market and the subsequent volatility of the mid-2020s.
- May 2022 (Terra-Luna Collapse): This event marked a systemic failure within the broader crypto ecosystem. The study found that price signals were prominent here, as the market gradually absorbed the stress of the de-pegging stablecoin before the final cascade.
- November 2022 (FTX Insolvency): Similar to the May event, the internal decay of a major exchange provided a window where market structure showed signs of strain before the ultimate price collapse.
- August 2024 (Market De-leveraging): In this instance, the signal was found almost exclusively in price action, while leverage and order-flow variables remained relatively quiet until the crash began.
- February 2025 (First Tariff Shock): This event represented a shift in the study’s findings. Linked to sudden external geopolitical news regarding trade tariffs, the price signal vanished. The market did not "slow down" before the crash; it was hit by an abrupt exogenous shock.
- October 2025 (Second Tariff Shock): Mirroring the February event, the October crash saw the warning signals migrate. Instead of appearing in the price, the statistical signature was found in leverage and order-flow data, suggesting that while the market was structurally prepared for a shock, the price itself did not telegraph the move.
The remaining two events in the study further reinforced this inconsistency, demonstrating that no single variable—whether price, open interest, or taker ratios—consistently carried a positive CSD signature across all seven crashes.
The Taker Order-Flow Paradox
One of the most intriguing findings of the paper involves the taker buy/sell ratio. Across six of the seven events (excluding those with insufficient data), a specific pattern emerged: the variance in taker order-flow tightened significantly before a cascade. This suggests a "calm before the storm," where the diversity of trading behavior narrows as the market reaches a state of fragile equilibrium.
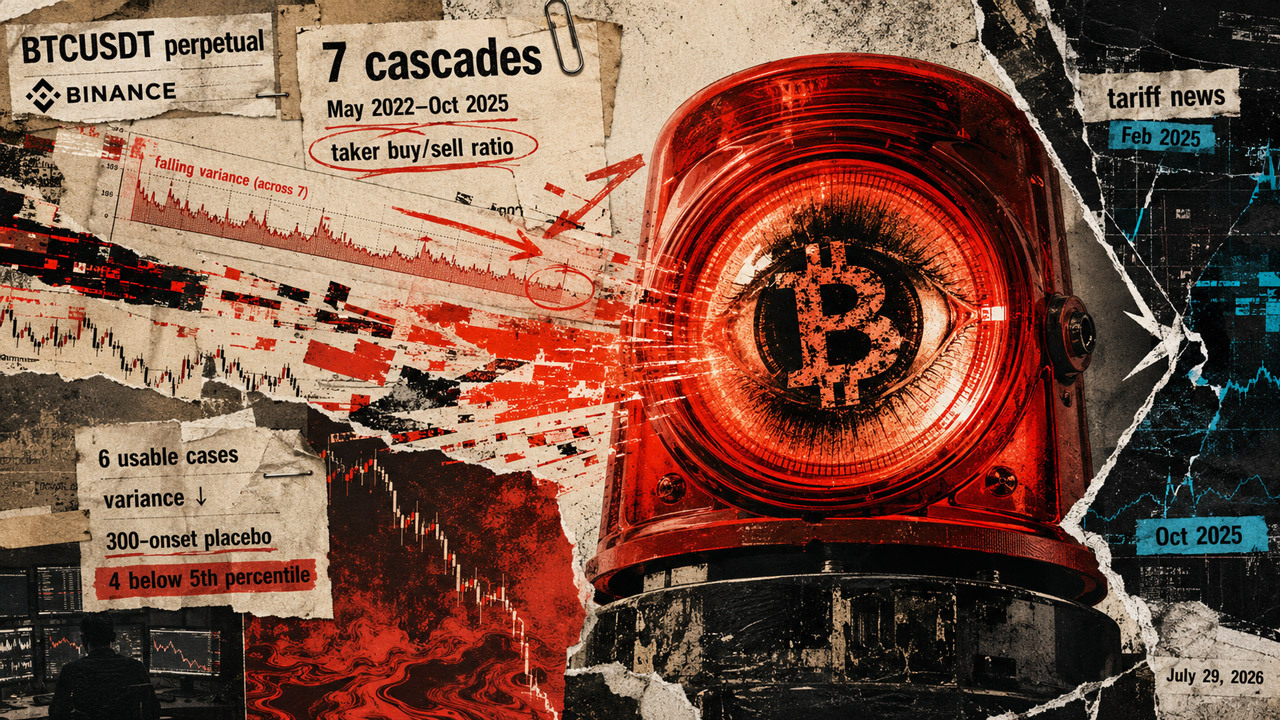
However, the study warns against using this as a definitive trading signal. While these observations fell into the "left tail" of a 300-onset placebo distribution—meaning they were statistically rare—four of the events were below the fifth percentile, but two others overlapped with ordinary, non-crash market conditions. This overlap means that if a trader were to sell every time taker-flow variance tightened, they would frequently be "stopped out" during normal market fluctuations. Seuma classifies this as a "population-level precursor" rather than a "reliable alarm." It is a signal that a crash is statistically more likely in the aggregate, but it remains insufficient for predicting any specific, individual event.
Methodological Constraints and the Role of Binance
The study’s reliance on Binance’s USD-margined BTCUSDT perpetual market is both a strength and a limitation. Binance remains the world’s largest liquidity hub for crypto derivatives, making its order book a primary driver of global price discovery. However, because direct, intraday snapshots of liquidations are often not made public in real-time, the researcher had to use proxies such as open interest and taker ratios.
Furthermore, the study did not account for other emerging factors that have begun to influence Bitcoin’s price discovery in 2025 and 2026. These include:
- Spot ETF Flows: The massive entry of institutional capital via exchange-traded funds has changed the "physics" of Bitcoin’s liquidity.
- Collateral Settings: Changes in how exchanges handle multi-asset collateral can dampen or exacerbate liquidation spirals.
- The Basis Trade: Large-scale arbitrage between spot and futures markets can mask underlying leverage risks.
The omission of these variables suggests that the "warning signs" may be even more complex and fragmented than the study suggests.
Analysis of Implications: Why the "Siren" Remains Silent
The implications of Seuma’s research are profound for the field of quantitative finance and retail trading. If the strongest recurring signs of a crash cannot warn of an individual event, then the "holy grail" of a universal liquidation alarm may not exist. This reinforces the "Adaptive Market Hypothesis," which suggests that as traders identify a signal and act upon it, the signal itself changes or disappears as the market evolves.
The distinction between "endogenous" (internal) and "exogenous" (external) shocks is particularly critical. When a crash is built on internal market stress—such as over-leverage during a slow price decline—the market structure may provide a "signature" of slowing down. But in an era where Bitcoin is increasingly sensitive to global macro-economic news, such as the tariff announcements of 2025, the speed of information transmission outpaces the market’s ability to "slow down" in a detectable way. The crash happens almost instantaneously, leaving no statistical trail for analysts to follow.

Post-Study Context: The June 2026 $1 Billion Liquidation
The limitations of predictive modeling were starkly illustrated just months after the study’s data window closed. On June 25, 2026, Bitcoin suffered a violent selloff that triggered approximately $1 billion in forced derivatives closures. This event was precipitated by markets pricing in a surprise Federal Reserve rate hike expected by October.
Because this was an exogenous macro shock, it likely would have joined the February and October 2025 events in failing to provide a price-based CSD signal. The June 2026 event serves as a real-world validation of Seuma’s hypothesis: as Bitcoin matures into a macro asset, the "warning signs" are increasingly found in the headlines of financial news rather than the mathematical residuals of the order book.
Conclusion and Future Outlook
Ramon Marc Garcia Seuma’s paper, though currently awaiting peer review, provides a sobering look at the limits of technical and statistical analysis in the world’s most volatile major asset class. The study concludes that while we can identify patterns that make a crash more probable across a population of events, the "signal" for any single crash is a chameleon, changing its form based on the trigger of the day.
For the broader industry, this research suggests a move away from purely technical "black box" models and toward a more holistic approach that integrates market structure with real-time macro-economic sentiment. As Bitcoin’s market cap hovers around $1.26 trillion and its dominance remains high at over 58%, the stakes for understanding these liquidation cascades have never been higher. However, for the individual trader looking for a "siren" to call the next crash, the evidence suggests that the most reliable warning sign is the realization that no such signal is truly reliable.