James Watt
The release of this week’s United States economic data has presented a complex puzzle for analysts, policymakers, and investors alike. At the heart of the discourse is a fundamental question that dictates the perceived health of the American economy: when consumer spending increases, does it signify an increase in the volume of goods purchased, or does it merely reflect the rising cost of the same items? Distinguishing between these two scenarios is critical for understanding the underlying stability of the nation’s financial landscape. If consumers are acquiring more goods and services, the economy demonstrates genuine growth. Conversely, if spending rises solely due to inflationary pressures while consumption remains stagnant or declines, the economy is effectively weakening beneath a veneer of nominal strength.
The convergence of several major economic reports this week—spanning inflation, retail sales, import prices, and industrial production—has highlighted the difficulty in reaching a definitive conclusion. Each report contains specific nuances and "blind spots" that require careful dissection to separate statistical noise from structural economic trends.
The Inflation Mirage and the Energy Factor
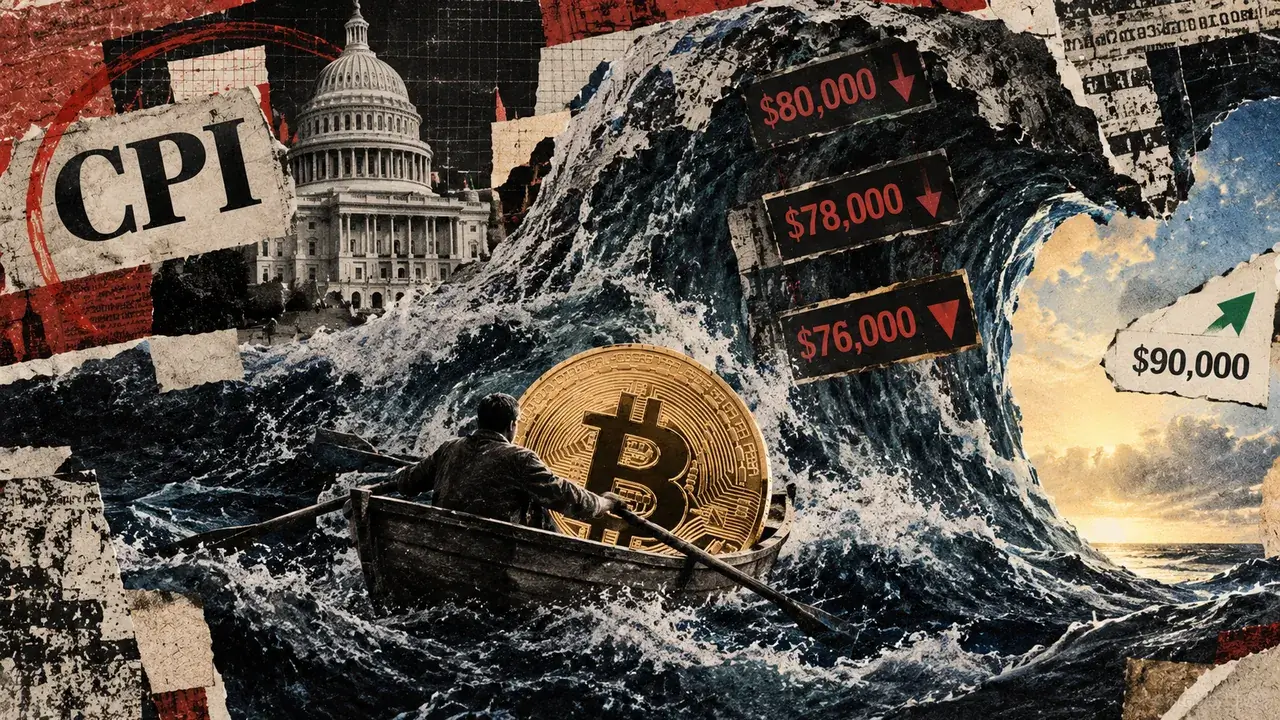
The narrative of the week began with the latest Consumer Price Index (CPI) report, which initially appeared to offer a reprieve from persistent price pressures. Headline inflation fell by 0.4% in June, marking the most significant one-month decline since 2020. This shift brought the annual inflation rate down to 3.5%. However, a closer examination reveals that this deceleration was almost entirely driven by a single, volatile category: energy.
During June, a temporary ceasefire in international conflicts led to a sharp, albeit brief, decline in global oil prices. This external factor exerted downward pressure on the headline figure, masking the reality of "core" inflation. When energy and food prices are excluded, the core inflation rate remained unchanged at 2.6% for the year. This lack of movement in core prices suggests that the underlying inflationary environment is far stickier than the headline drop suggests. For markets like Bitcoin, which initially rallied on the news of "cooling" inflation, the realization that the progress was tied to volatile energy costs has caused initial optimism to wane.
Retail Sales: Nominal Growth vs. Real Consumption
On Thursday, the U.S. Census Bureau released the June retail sales report, a primary indicator of consumer demand. The report indicated a modest 0.2% increase in sales. To the casual observer, this figure might suggest a consumer base that is losing momentum. However, the internal mechanics of the report tell a different story.
Retail sales are reported in raw dollars and are not adjusted for inflation. This creates a "price illusion." For example, in May, retail sales were reported at $763.7 billion, a 0.9% increase from April. While this appeared to be a robust jump, inflation-adjusted data revealed that real consumption grew by only 0.4%. Much of the May increase was attributed to a 3.4% rise in gasoline station sales, driven by higher fuel prices rather than increased volume.
The June data presented the inverse effect. The headline growth of 0.2% was suppressed by a significant drop in gasoline station receipts—the largest decline since December 2022—resulting from the temporary dip in fuel prices. When the volatile auto and gasoline sectors are stripped away, "core" retail sales actually rose by 0.4%. Furthermore, the "control group" sales—a specific metric that excludes food services, auto dealers, building materials, and gas stations, and feeds directly into GDP calculations—climbed by a solid 0.5%. This suggests that despite the soft headline number, American consumers remained resilient in June, redirecting their savings from cheaper gas into other categories, particularly online shopping and vehicle purchases.
The Import Price Gap and the Tariff Omission
The Bureau of Labor Statistics (BLS) added another layer to the economic picture on Friday with the release of import price data. Import prices rose by a marginal 0.3% in June, a sharp slowdown from the 1.9% and 2.0% increases seen in May and April, respectively. Export prices, meanwhile, fell by 0.6%, marking the first monthly decline after half a year of steady advances.
Similar to the inflation report, the slowdown in import prices was heavily influenced by the temporary reprieve in fuel costs. Non-fuel imports, including capital goods and consumer products, continued to creep upward. However, the critical "blind spot" in this report is its exclusion of tariffs and customs duties. The BLS measures trade flows based on the prices paid to foreign entities, not the final cost incurred by U.S. businesses or consumers after government levies are applied.
As the July 7-8 collapse of the ceasefire led to a 15% surge in oil prices, the "calm" reflected in the June import data is expected to be short-lived. Furthermore, the omission of tariffs means the report may fail to capture the rising costs of imported machinery, electronics, and automotive parts that are currently working their way through the supply chain toward retail shelves.
Manufacturing Stagnation: The Tiebreaker
While spending data can be ambiguous, industrial production serves as a vital tiebreaker for assessing economic health. The Federal Reserve’s June data, also released on Friday, showed that manufacturing output in the United States has stalled.
Total industrial production edged up only because of a spike in utility usage driven by summer cooling demands. Manufacturing output itself went sideways, with durable goods production—specifically machinery and electrical equipment—experiencing declines. Capacity utilization, which measures how much of the nation’s factory potential is being used, fell slightly to 75.7%. This remains significantly below the long-run average, signaling that American plants have a surplus of idle capacity.
This stagnation in manufacturing is a crucial data point. If the 0.5% rise in the retail control group represented a genuine increase in the volume of goods being "taken home" by Americans, one would expect a corresponding increase in factory orders and production to replenish inventories. Instead, the gap between spending dollars and physical production is widening. This suggests that a significant portion of consumer spending is being absorbed by higher prices for services or imported goods, rather than stimulating domestic industrial growth.
The Consumer Squeeze: Spending Beyond Means
The sustainability of current spending patterns is increasingly being called into question. Data from the New York Fed’s June Survey of Consumer Expectations provides a sobering look at the financial mindset of the American household. On average, respondents expect their spending to increase by 5% over the next year, while expecting their incomes to grow by only 3%.
This 2% gap indicates that consumers are likely dipping into pandemic-era savings, increasing credit card debt, or "trading down" to lower-cost brands to maintain their standard of living. These are not the behaviors of a thriving, confident consumer, but rather of a population feeling the squeeze of "cost-of-living" inflation.
The survey further revealed that while consumers expect gasoline prices to eventually stabilize, they are bracing for significant increases in non-discretionary expenses. Households expect medical costs to rise by 9.4% and rent to climb by 8.3% over the next twelve months. These "sticky" costs represent a significant burden that temporary drops in energy prices cannot alleviate.
Market Implications and the Federal Reserve’s Dilemma
The convergence of resilient spending and stubborn core inflation places the Federal Reserve in a difficult position. The central bank is currently maintaining interest rates in the 3.50% to 3.75% range. While the soft headline inflation report briefly increased market hopes for a September rate cut, the steady retail demand and stalled manufacturing output complicate that trajectory.
Strong consumer spending suggests that the economy may not yet require the stimulus of lower rates. However, if that spending is fueled by debt rather than income growth, and if it is paired with core inflation that refuses to return to the Fed’s 2% target, the risk of "stagflation"—low growth combined with high inflation—increases.
For high-risk assets like Bitcoin, this environment is particularly challenging. Bitcoin has recently fluctuated around the $64,700 mark, sensitive to changes in government bond yields and interest rate expectations. A "higher-for-longer" interest rate environment generally drains liquidity from speculative markets. If the Fed determines that spending is too robust to justify a cut, or if a renewed oil shock reignites inflation fears in July, the tailwinds that have supported recent crypto rallies could quickly turn into headwinds.
Conclusion: The Reality Beneath the Numbers
The economic data from June paints a picture of an economy in transition, where headline figures often obscure more troubling underlying trends. While the 0.2% retail sales growth was labeled as "weak," it actually masked a consumer who is still actively spending. However, the fact that this spending is not being met by an increase in domestic manufacturing suggests that the "price illusion" remains a dominant force.
The primary takeaway for the second half of the year is that the American consumer is resilient but increasingly leveraged. With the temporary relief of June’s energy prices already reversing and core costs for housing and healthcare continuing to climb, the disconnect between nominal spending and real economic output will likely remain the central challenge for the U.S. economy. As the Federal Reserve prepares for its upcoming meetings, the focus will shift from headline volatility to the sustainability of consumer behavior and the persistent reality of core inflation.