Market analysts are in broad agreement that Bitcoin’s (BTC) recent rally, propelling the digital asset to the $76,000 mark, represents a definitive "clear momentum shift" within the cryptocurrency landscape. This significant price action has effectively solidified a short-term uptrend for BTC, rekindling optimism across the market. The surge is not merely a fleeting movement but appears underpinned by a confluence of robust on-chain data and supportive macroeconomic indicators, suggesting that the current upward trajectory may have further room to run before encountering significant exhaustion. Investors and traders are now keenly observing key resistance and support levels, as well as broader market dynamics, to gauge the sustainability and potential magnitude of this renewed bullish phase.
The analysis of Bitcoin’s short-term holder (STH) supply in profit, a critical on-chain metric derived from Glassnode data, offers a compelling insight into the market’s current state. This metric measures the percentage of recently acquired coins currently held at an unrealized gain, acting as a barometer for potential selling pressure. Historically, local tops during bear market rallies have tended to materialize when this metric approaches its statistical mean of 54.2%. This threshold typically signifies a point where the concentration of profitable short-term holders becomes sufficient to trigger meaningful distribution, as these investors opt to secure their gains. Crucially, the current STH supply in profit stands at 43.2%. This figure remains "meaningfully below that threshold," as highlighted by Glassnode in its latest "Week Onchain" newsletter. This implies that the present rally has not yet reached the zone of typical exhaustion, leaving "slight room for further upside toward the True Market Mean," while simultaneously providing a quantitative level for market participants to monitor as the price continues its advance. This on-chain perspective suggests that the psychological point where short-term holders are likely to flood the market with sell orders is still some distance away, allowing for continued price appreciation as long as other factors remain supportive. The inherent structure of the market, as revealed by these on-chain metrics, indicates a degree of resilience and untapped potential for growth in the near to medium term.
The Anatomy of the Rally: On-Chain Indicators Provide Depth
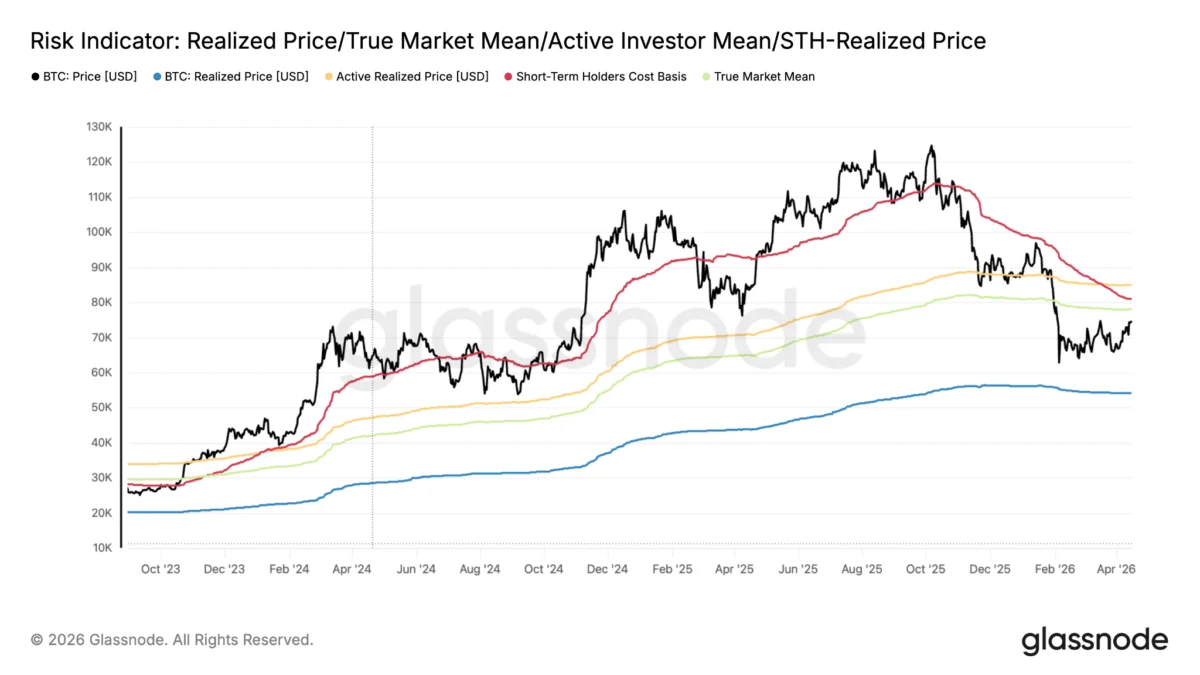
The recent price movement, culminating in Bitcoin breaching $76,000, has been a subject of intense scrutiny from on-chain analytics firms. Beyond the STH supply in profit, other metrics contribute to a comprehensive understanding of the market’s health. The "True Market Mean," currently positioned around $78,140, is a pivotal metric tracking the cost basis of the active Bitcoin supply. Bitcoin’s current trading price of $74,000 (at the time of initial analysis) places it approximately 5.2% below this significant threshold. While the price has yet to "test and stabilize above this key threshold," Glassnode’s analysis underscores that "the probability of a spike toward and potentially above it remains considerable in the mid-term." This suggests that the market is building momentum towards re-establishing a healthier valuation relative to the average acquisition cost of active participants.

Further reinforcing the significance of these on-chain levels is the "Active Realized Price" at $85,100 and the "STH Cost Basis" at $80,950. These metrics represent the average price at which all bitcoins (Active Realized Price) or specifically those held by short-term holders (STH Cost Basis) last moved on-chain. When the market price moves above these realized prices, it typically signals a broad-based profitability for investors, often fueling further upward momentum. The current position below these levels, but with a strong upward trajectory, implies that a significant portion of the market is still waiting to break even or secure larger profits, thereby reducing immediate selling pressure and building a base for potential future gains. The on-chain data, therefore, paints a picture of a market still in accumulation mode or early stages of a bull run, rather than nearing an overheated distribution phase.
Technical Battlegrounds: Moving Averages and Price Targets
Complementing the insights from on-chain analysis, traditional technical indicators also lend credence to the bullish narrative. Analyst McKenna highlighted that Bitcoin has remained in "deep under extension territory" relative to its 50-week simple moving average (SMA), which currently sits at $96,800. The concept of mean reversion is fundamental in financial markets: when asset prices deviate significantly, either to the upside or downside, they typically revert back towards their historical averages. Bitcoin’s prolonged distance below its 50-week SMA suggests a strong gravitational pull back towards this longer-term average, implying substantial upside potential.
McKenna articulated a directionally bullish stance, asserting that with "clear momentum shifts and bullish trending signals firing," a move higher is increasingly probable. The analyst emphasized a critical trigger point: "BTC breaking above $74K and holding this level on a HTF [higher timeframe] is the final trigger I want to see to be confident in mid to high 80s over the coming weeks." This technical observation provides a clear actionable level for traders, indicating that a sustained breakout above $74,000 would solidify the short-term bullish case and open the path towards targets in the $80,000s. Other technical indicators, while not explicitly mentioned in the initial report, would likely be scrutinized by analysts in such a scenario. A strengthening Relative Strength Index (RSI) moving out of oversold territory or consolidating in bullish ranges, coupled with increasing trading volumes on upward price movements, would further confirm the underlying strength of the rally. The confluence of these technical signals, from the mean reversion potential of the 50-week SMA to breakout confirmations on shorter timeframes, provides a multi-faceted argument for continued upward momentum.
Macroeconomic Tailwinds: The Dollar’s Retreat

Beyond the intrinsic market mechanics and technical patterns of Bitcoin, broader macroeconomic forces are also playing a pivotal role in fueling the current rally. Fellow analyst Bitcoin Archive drew attention to the falling US dollar index (DXY), characterizing it as a "massive tailwind for the next leg up" for Bitcoin. The inverse relationship between the strength of the US dollar and the price of Bitcoin is a well-established phenomenon. A weakening dollar typically makes alternative assets, particularly those denominated in USD like Bitcoin, more attractive to international investors as their purchasing power in dollar terms increases. This encourages capital flows out of traditional fiat currencies and into digital assets.
The global economic landscape at the time of this rally, likely in early 2026, would be a critical determinant of DXY’s trajectory. Factors such as evolving monetary policies from major central banks, inflation expectations, and global economic growth forecasts would all contribute to the dollar’s performance. If the Federal Reserve were to signal a more dovish stance or if other major economies showed stronger growth, the DXY could continue its descent, thereby providing sustained support for Bitcoin. Conversely, any hawkish shifts in monetary policy or unexpected economic strength in the US could strengthen the dollar and create headwinds for BTC. The current DXY trend, as highlighted, suggests a period where the macroeconomic environment is broadly supportive of risk assets, with Bitcoin positioned to benefit significantly from a weaker dollar regime.
Chronology of Recent Market Movements
To fully appreciate the significance of the current rally, it is essential to contextualize it within Bitcoin’s recent price history. Following an impressive ascent that saw Bitcoin reach an all-time high of approximately $126,000, the cryptocurrency experienced a substantial correction, enduring a 41% drawdown. This period of consolidation and retracement tested the resilience of investors and saw BTC/USD drop below several key pricing levels, including the active realized price, STH cost basis, and the true market mean.
The market, however, began to show signs of recovery with a notable rally observed between October 2024 and January 2025. This period served as a crucial phase of accumulation and re-establishment of market confidence, providing a launching pad for subsequent moves. After this initial recovery, Bitcoin entered a phase of consolidation, building a base before the latest breakout. The current rally to $76,000 marks a decisive move out of this consolidation, reflecting renewed bullish sentiment and a re-engagement of capital. This chronological progression highlights a market that has weathered a significant downturn, found its footing, and is now attempting to reclaim higher valuations, with the $76,000 breach serving as a testament to its current strength. Key events that may have influenced this chronology include the anticipation and eventual approval of Bitcoin spot ETFs in various jurisdictions, which opened new avenues for institutional investment, and evolving global regulatory clarity that reduced market uncertainty.

Navigating Critical Price Levels: Resistance and Support
The current Bitcoin rally is unfolding amidst a landscape of crucial on-chain and technical price levels that will dictate its immediate future. As the price advanced, it navigated past several psychological and technical barriers. The 41% drawdown from the previous all-time high of $126,000 had seen the BTC/USD pair dip below key pricing levels such as the active realized price at $85,100, the short-term holder cost basis at $80,950, and the true market mean, which currently stands at $78,140. Reclaiming these levels sequentially will be vital for a sustained bull run.
The immediate and most significant resistance level for Bitcoin is identified around $78,000. This is not merely a psychological barrier but a zone of substantial historical accumulation, as evidenced by the cost basis distribution heatmap. Glassnode data shows that over 200,000 BTC were acquired around this price point. A successful break and stabilization above $78,000 would signal that these previously "underwater" or break-even investors are now in profit, potentially converting this resistance into new support and opening the path to higher valuations, possibly towards the active realized price of $85,100 and beyond.
On the downside, critical support levels are equally important to monitor. The first major support lies at $72,000, a level where the 20-day and 50-day exponential moving averages (EMAs) appear to converge, creating a strong technical floor. This price point also represents a significant accumulation zone, with investors having acquired approximately 220,000 BTC around this value. A bounce from this level would reinforce the bullish trend. Below $72,000, the $65,000-$70,000 demand zone emerges as a crucial area to watch. This price band has historically served as a vital support level, notably acting as a launching pad for the robust rally seen between October 2024 and January 2025. The resilience of this zone in previous market cycles underscores its importance; a strong defense of this range would signal underlying buying strength. Conversely, as Cointelegraph previously reported, a decisive drop below the $70,000 mark would suggest that bears are regaining control, significantly increasing the prospects of a further decline toward the $60,000 level, potentially invalidating the immediate bullish momentum.
Market Sentiment and Expert Commentary

The current market sentiment, while broadly bullish, is tinged with cautious optimism. The explicit statements from Glassnode and analyst McKenna provide a foundation for this perspective, but wider market commentary offers further depth. Prominent institutional investors, who have increasingly allocated capital to Bitcoin, have largely echoed the sentiment that the digital asset is demonstrating resilience. "We’ve seen a healthy consolidation period, and the recent breakout is a testament to Bitcoin’s underlying demand and the growing maturity of its market structure," stated a portfolio manager at a leading digital asset fund, speaking on condition of anonymity due to internal media policies. "The institutional interest, particularly with the advent of spot ETFs, is providing a more stable and predictable demand side, moving beyond the purely speculative retail-driven cycles of the past."
Retail investors, often swayed by rapid price movements, appear to be re-engaging with the market, but with a degree of prudence learned from past volatility. Social media sentiment indicators show a marked increase in positive discussions around Bitcoin, though without the feverish euphoria characteristic of previous bubble tops. This measured enthusiasm suggests a more mature investor base, focusing on fundamental analysis and on-chain metrics rather than pure speculation. Market strategists from traditional finance firms are also taking note. A recent report from a global investment bank highlighted Bitcoin’s increasing correlation with traditional safe-haven assets amidst global macroeconomic uncertainty, further cementing its role as a diversifier in institutional portfolios. This collective sentiment, ranging from on-chain analysts to institutional players and retail participants, points towards a market that is fundamentally stronger and more mature than in previous cycles, capable of sustaining rallies on more solid ground.
Broader Market Implications and Future Outlook
The trajectory of Bitcoin in the coming weeks and months holds significant implications for the broader cryptocurrency market and even traditional finance. A sustained rally for Bitcoin typically acts as a tide that lifts all boats, stimulating activity and investment in altcoins. Bitcoin’s market dominance, while fluctuating, remains a key indicator of overall market health. If BTC maintains its upward momentum and breaks through key resistance levels, it is highly probable that we will see capital spill over into Ethereum (ETH) and other large-cap altcoins, followed by mid- and small-cap projects. This "altcoin season" dynamic is a familiar pattern in crypto bull markets, and the current Bitcoin rally could be the precursor to such a widespread market expansion.
For institutional adoption, a period of sustained price appreciation and reduced volatility (relative to previous market cycles) would further legitimize Bitcoin as a viable asset class. The performance of Bitcoin spot ETFs, which have garnered significant attention, would likely improve, attracting more conservative institutional capital that prefers regulated investment vehicles. This increased institutional engagement could lead to greater liquidity, reduced price manipulation, and a more robust market infrastructure.

However, the path forward is not without risks. Regulatory shifts, particularly in major economic blocs, could introduce uncertainty. While the current trend leans towards clearer regulations, any unexpected crackdown or adverse policy changes could dampen market sentiment. Macroeconomic reversals, such as a sudden strengthening of the US dollar due to unexpected inflation spikes or aggressive interest rate hikes, could also create significant headwinds. Geopolitical events, often unpredictable, also have the potential to disrupt global markets, including cryptocurrencies.
Despite these potential challenges, the long-term outlook for Bitcoin, particularly within the narrative of "digital gold" and a hedge against inflation, appears to be strengthening. As central banks globally continue to grapple with inflationary pressures and traditional financial systems face increasing scrutiny, Bitcoin’s decentralized nature and finite supply offer an attractive alternative. The current rally, supported by strong on-chain fundamentals and a favorable macroeconomic backdrop, suggests that Bitcoin is not just recovering from a drawdown but is potentially entering a new phase of growth, steadily solidifying its position within the global financial ecosystem.
In conclusion, Bitcoin’s recent surge to $76,000 marks a significant turning point, characterized by a clear momentum shift and a robust short-term uptrend. The convergence of compelling on-chain data, favorable technical indicators, and a supportive macroeconomic environment paints a largely optimistic picture for the digital asset. While critical resistance levels, particularly around $78,000, must be decisively breached, the underlying market structure suggests ample room for further upside before typical exhaustion sets in. Investors will need to remain vigilant, monitoring these key price levels and broader economic indicators, but the prevailing sentiment indicates that Bitcoin is well-positioned for continued growth, potentially reclaiming and surpassing previous highs in the foreseeable future.