The digital asset market witnessed a significant shift in momentum during the first week of March as Bitcoin (BTC) surged past critical resistance levels, positioning the cryptocurrency for a potential run toward the psychological and technical threshold of $80,000. This bullish outlook is supported by a confluence of technical chart patterns, derivatives market data, and a notable shift in investor sentiment reflected in prediction markets. On Wednesday, Bitcoin’s price action effectively invalidated a burgeoning bearish setup, replacing it with a bullish structure that suggests the current rally has substantial room to grow.
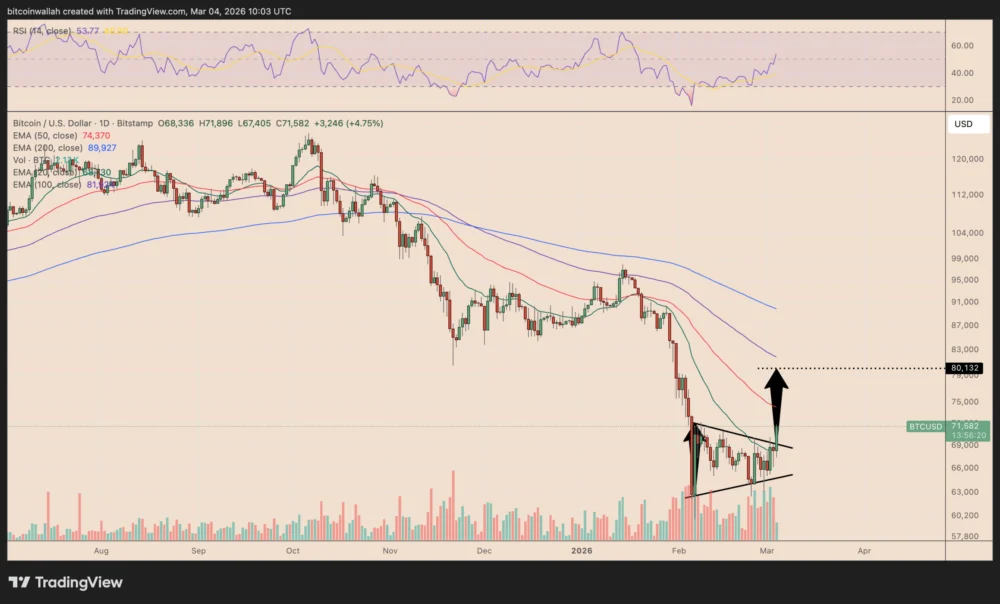
The primary catalyst for this renewed optimism was a 5.21% intraday jump that propelled Bitcoin to approximately $71,900. This movement was not merely a price spike but was accompanied by a significant increase in trading volume, a key metric that analysts use to confirm the validity of a breakout. When price increases are backed by high volume, it typically indicates strong conviction among buyers and a higher probability that the upward trend will be sustained. This specific move allowed Bitcoin to pierce the upper trend line of what many traders had previously identified as a bear pennant, a technical formation that usually precedes a downward continuation. By breaking above this level, Bitcoin transformed a potentially negative outlook into a platform for further gains.
Technical Transformation: From Bear Pennant to Symmetrical Triangle
The invalidation of the bear pennant has led technical analysts to re-evaluate the prevailing chart structure, with many now identifying a symmetrical triangle bullish reversal. A symmetrical triangle is characterized by a series of lower highs and higher lows that converge into a narrowing price range. This pattern represents a period of consolidation where the market is "coiling," building energy for a decisive move in either direction. In the case of Bitcoin, the breakout to the upside suggests that the bulls have successfully absorbed selling pressure and are now in control of the narrative.

To determine the potential target of such a breakout, analysts utilize a "measured move" calculation, which involves measuring the widest part of the triangle—in this instance, the range between $63,000 and $71,000—and projecting that distance from the point of the breakout. This calculation yields a price target of approximately $80,000. This target is not merely an arbitrary figure; it aligns closely with Bitcoin’s 100-day exponential moving average (EMA), a long-term trend indicator that often acts as a significant level of support or resistance.
However, the path to $80,000 is not without immediate obstacles. Market data indicates that Bitcoin faces a critical hurdle at the 50-day EMA, currently situated near $74,400. A clean break above this red-line indicator would likely accelerate the move toward the $80,000 target. Conversely, a failure to clear this resistance could lead to a temporary pullback toward the 20-day EMA, located near $68,700, as the market seeks to establish a firmer base of support.
The Role of CME Futures Gaps as Liquidity Magnets
One of the most compelling pieces of evidence supporting the $80,000 target is the existence of an unfilled gap in the Chicago Mercantile Exchange (CME) Bitcoin futures market. CME gaps occur because the institutional futures market closes over weekends and holidays, while the underlying spot market for Bitcoin operates 24/7. If the spot price moves significantly during the hours the CME is closed, the futures market reopens at a price different from its previous close, creating a "gap" on the daily chart.
Historically, these gaps act as "magnets" for price action. Statistical analysis of Bitcoin’s price history shows that approximately 90% of CME gaps are eventually "filled," meaning the price returns to that specific zone to bridge the technical vacuum. Since early February, a prominent gap has remained open between $79,660 and $81,210. The fact that nine of the last ten CME gaps since August 2025 have been filled reinforces the belief among institutional traders that Bitcoin is mathematically and historically predisposed to revisit this $80,000 region. This alignment between spot technical patterns and futures market anomalies provides a dual-layered thesis for the current bullish trajectory.

Institutional Inflows and the Impact of Spot ETFs
The underlying strength of the current rally is also deeply rooted in the continued success of U.S.-based spot Bitcoin Exchange-Traded Funds (ETFs). Recent data shows that these financial products added a net $225 million in inflows, a figure that highlights persistent institutional demand despite localized selling pressure.
BlackRock’s iShares Bitcoin Trust (IBIT) has emerged as the primary driver of this institutional wave. The IBIT fund has consistently offset redemptions from other products, such as the Grayscale Bitcoin Trust (GBTC), which has seen steady outflows as investors migrate toward funds with lower fee structures. The net positive inflow into ETFs is a crucial component of the current market structure because it represents "sticky" capital—money from pension funds, wealth managers, and retail brokerage accounts that tends to hold positions longer than speculative derivative traders. This steady absorption of the available Bitcoin supply on exchanges creates a "supply shock" dynamic, where increasing demand meets a dwindling liquid supply, naturally exerting upward pressure on the price.
Prediction Markets Reflect a Shift in Sentiment
The bullish sentiment is further corroborated by data from Polymarket, a decentralized prediction platform where participants wager on real-world outcomes. Prediction markets are often viewed as a "wisdom of the crowds" indicator, as they require participants to back their predictions with capital.
As of Wednesday, the odds of Bitcoin reaching $80,000 in March have surged to 40%, a doubling from the 20% probability recorded just 24 hours prior. Even more striking is the conviction surrounding a $75,000 target, which now carries a 70% probability according to market participants. Simultaneously, the probability of Bitcoin dropping to $65,000 or $60,000 has diminished significantly. This shift suggests that the broader trading community is actively "de-risking" their downside expectations and repositioning for a breakout. When prediction markets move this aggressively in a short period, it often reflects a broader consensus among both retail and sophisticated investors that the market has reached a local bottom and is ready for the next leg up.

Macroeconomic Context and Market Implications
The broader economic environment also provides a backdrop that may be favoring risk-on assets like Bitcoin. While inflation data remains a point of contention for central banks, the relative stability of the U.S. dollar and the ongoing discussions regarding potential interest rate pivots later in the year have created a favorable environment for scarce assets. Bitcoin is increasingly viewed not just as a speculative vehicle, but as a digital alternative to gold—a hedge against currency debasement and a play on the increasing digitization of the global financial system.
If Bitcoin successfully reaches and sustains the $80,000 level, the implications for the broader cryptocurrency ecosystem would be profound. Such a move would likely trigger a massive "short squeeze," where traders who bet against the price are forced to buy back their positions, further fueling the rally. Additionally, an $80,000 Bitcoin would likely catalyze a renewed "altcoin season," as capital begins to rotate from the market leader into smaller-cap digital assets, seeking higher percentage returns.
Conclusion and Risk Factors
While the indicators are currently flashing green, market participants remain cognizant of the inherent volatility in the digital asset space. Technical breakouts can occasionally result in "fakeouts," where the price briefly moves above resistance only to collapse back into the previous range. Furthermore, unexpected macroeconomic shocks or regulatory announcements could quickly alter the current trajectory.
However, the current confluence of a volume-backed technical breakout, a high-probability CME gap fill, consistent institutional ETF inflows, and a sharp rise in prediction market confidence presents one of the most cohesive bullish cases for Bitcoin in recent months. As the market moves deeper into March, the $74,400 and $80,000 levels will remain the primary focal points for traders worldwide. Whether Bitcoin can maintain this momentum and achieve a new all-time high will depend on its ability to clear immediate resistance and the continued appetite of institutional buyers to absorb any temporary selling pressure. For now, the bulls appear to have the upper hand, with $80,000 transitioning from a speculative hope to a statistically supported target.