James Watt
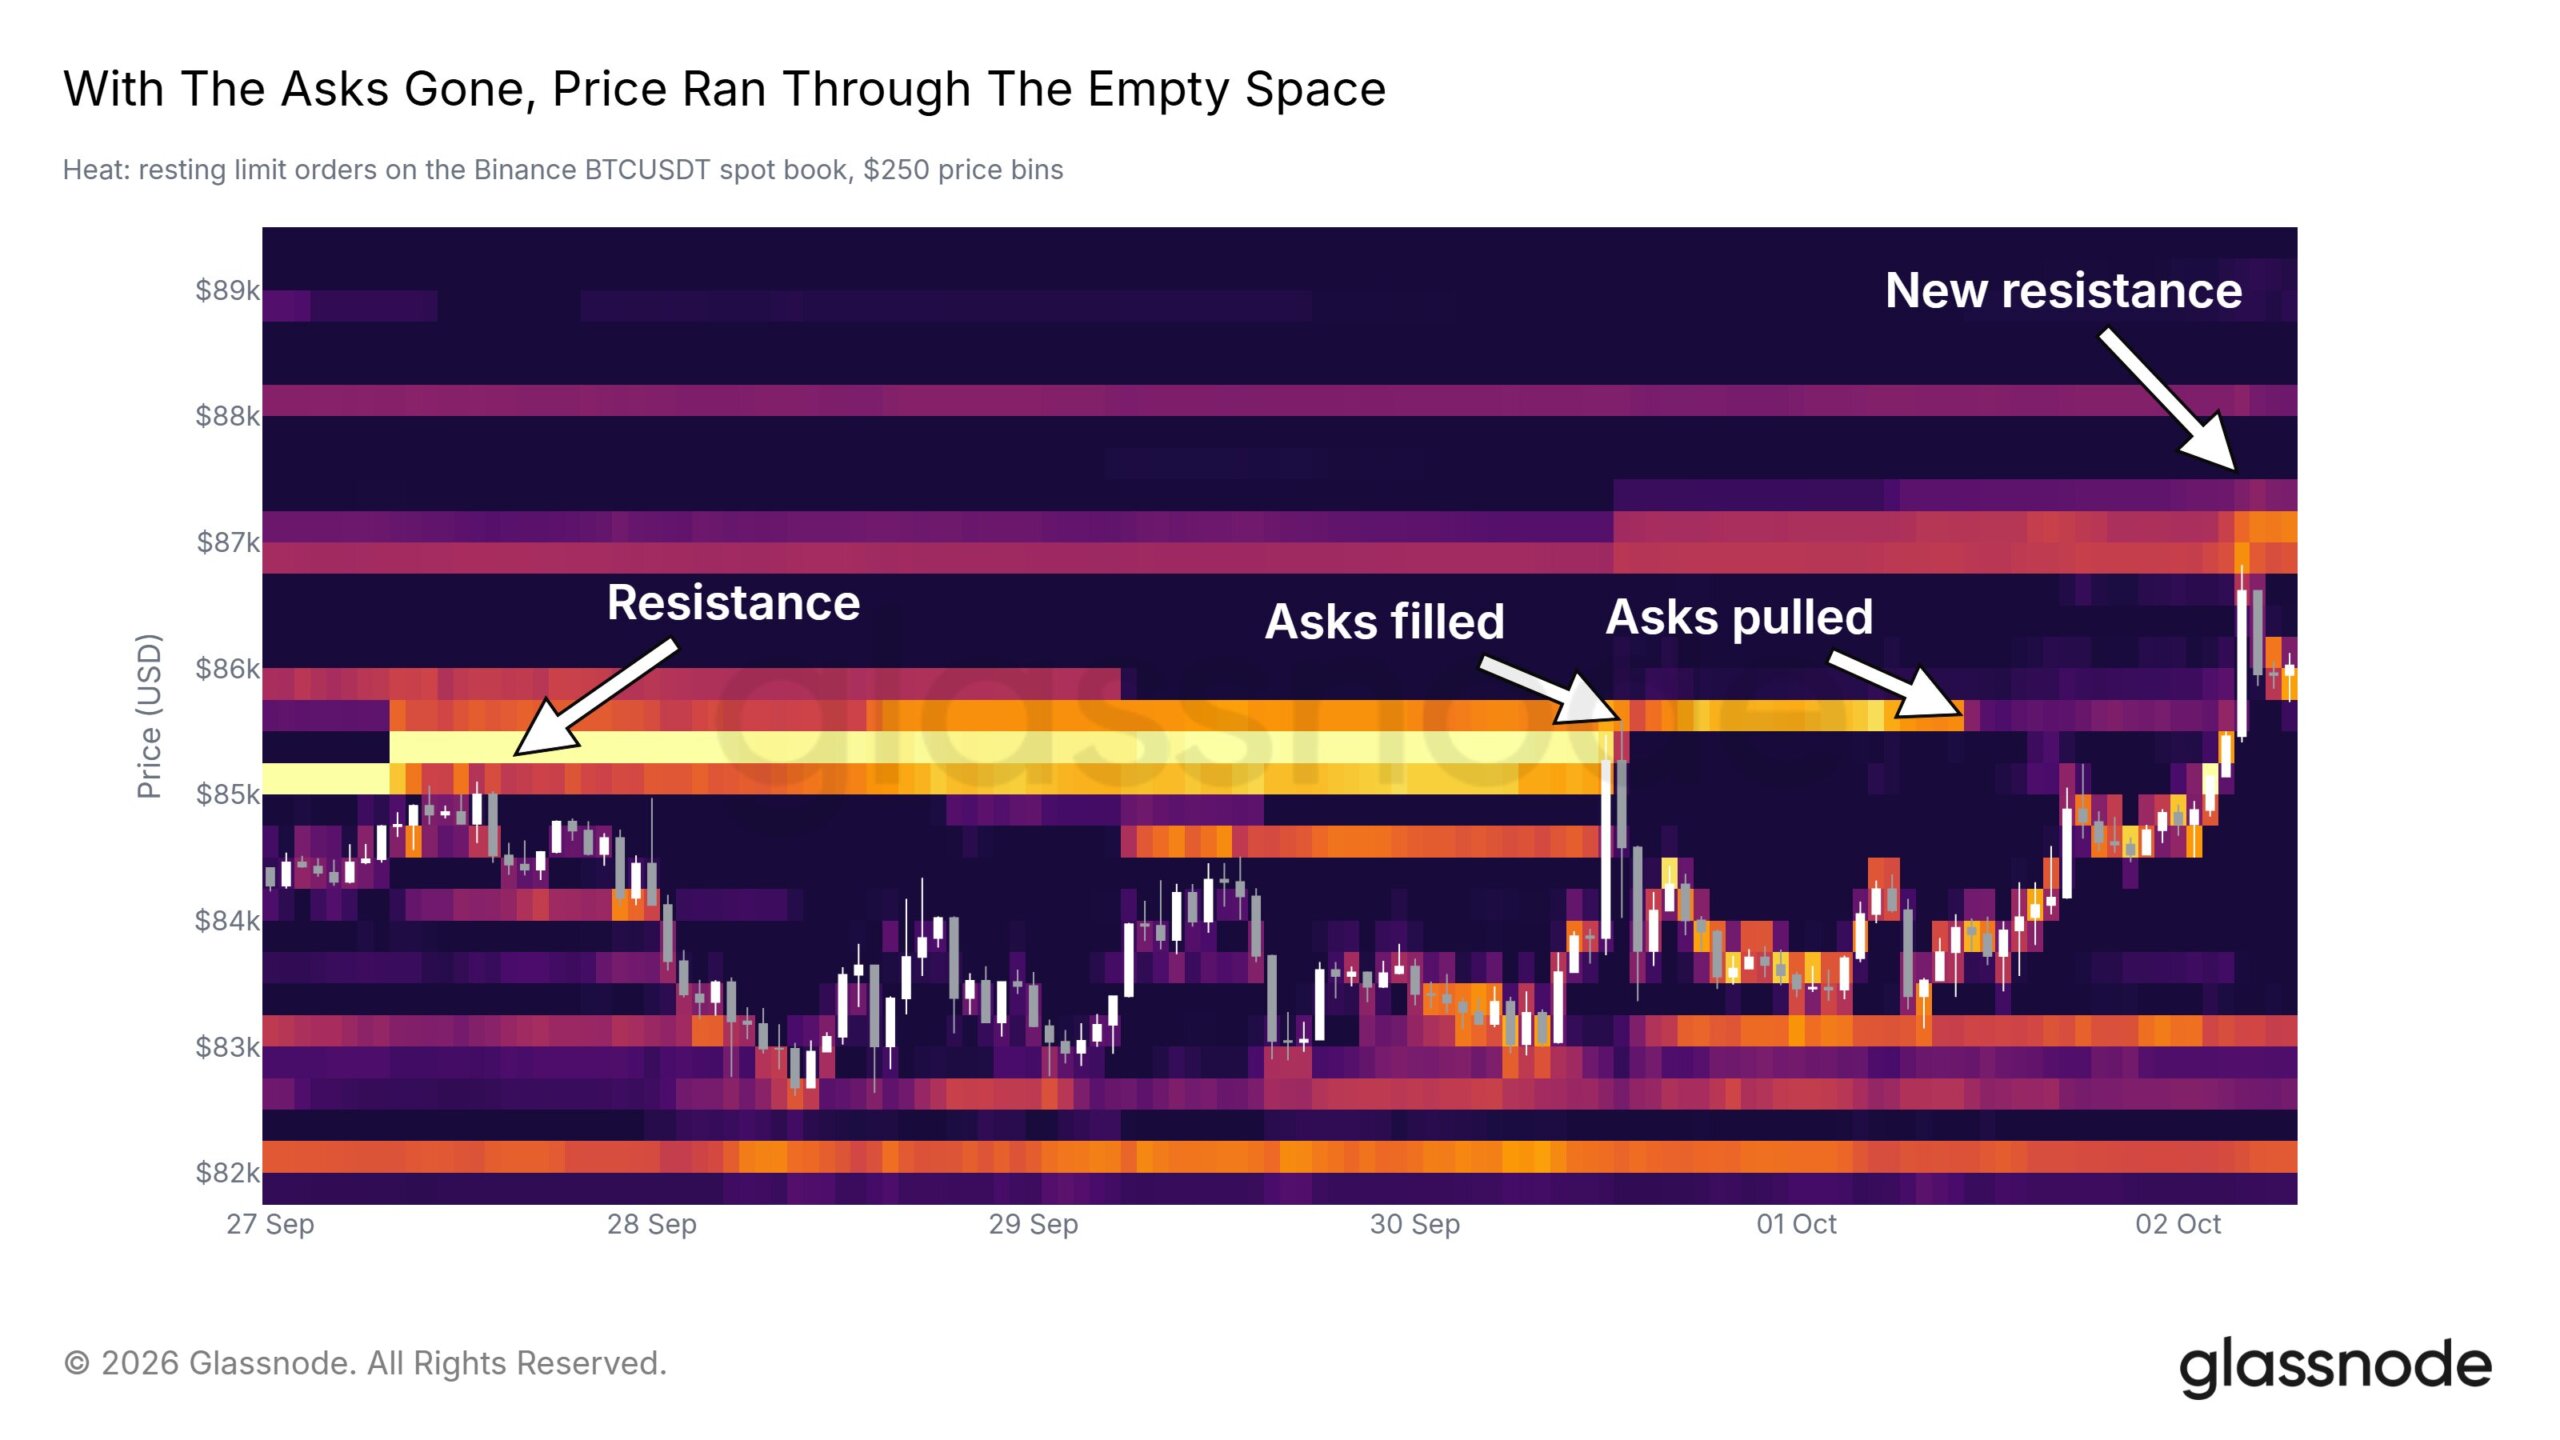
The global cryptocurrency market is currently navigating a pivotal juncture as Bitcoin approaches a critical psychological and technical test at the $90,000 threshold. This upward trajectory follows a significant breakthrough on October 2, when Bitcoin registered an intraday high of $87,000. This movement was precipitated by buyers successfully dismantling a substantial "sell wall" at the $85,000 level—a price point that had previously acted as a formidable barrier, stalling multiple attempts at an advance. Data from the on-chain analytics firm Glassnode indicates that while some of these sell orders were filled, a significant portion was withdrawn by traders, resulting in a thinning of sell-side liquidity. This vacuum has left a smaller concentration of asks around the $87,000 mark, potentially clearing the path for further price discovery with less immediate resistance.
Technical Breakthrough and the Dissolution of the $85,000 Sell Wall
The recent price action represents more than just a numerical increase; it signifies a shift in market structure. For several weeks, the $85,000 level served as a focal point for profit-taking and institutional distribution. However, the exhaustion of this supply has fundamentally altered the order book. When a major sell wall vanishes—either through absorption by aggressive buying or through cancellation by sellers who anticipate higher prices—the resulting "liquidity gap" often leads to rapid, volatile moves.
Glassnode’s analysis suggests that the current environment is characterized by "thinning liquidity," a state where even moderate buying pressure can result in outsized price gains because there are fewer resting sell orders to act as a buffer. This phenomenon was evident during the push to $87,000, where the lack of visible liquidity immediately above the previous resistance allowed for a swift ascent. As Bitcoin stabilizes in this new range, the market is now looking toward the $90,000 to $100,000 corridor, which is increasingly viewed as the next major zone of contention.
The Revival of Rare Accumulation Patterns
Complementing the price action is the reappearance of a rare technical setup on CryptoQuant’s Bitcoin Accumulation Trend chart. The bands on this indicator have begun to contract sharply, reviving a pattern that historically preceded significant market rallies. According to historical data, similar contractions occurred in early 2025, specifically between March 5 and March 8, and again between April 17 and April 20.
During the April 2025 episode, Bitcoin was trading near $84,000 before embarking on a rally that took the asset toward $109,000. While the number of historical occurrences is limited, making the pattern far from a guaranteed predictor, the alignment of this indicator with broader market improvements has caught the attention of institutional analysts. The Accumulation Trend tracks the buying and selling behavior of various cohorts—ranging from "minnows" to "whales"—and a narrowing of these bands suggests a period of intense supply absorption. When different groups of holders move in relative unison toward accumulation, it often signals a collective sentiment shift that precedes a breakout.
The Psychology of the Underwater Holder: Resistance at $88,000 and $89,000
As Bitcoin climbs, it moves toward a "supply zone" populated by investors who have been holding at a loss for extended periods. This demographic, often referred to as "underwater" holders, plays a crucial role in determining price ceilings. CryptoQuant analyst Darkfost has identified two specific cohorts that may provide significant overhead supply as they approach their breakeven points.
Investors who acquired Bitcoin between 18 months and two years ago possess an average cost basis of approximately $88,350. Meanwhile, the cohort that entered the market six to 12 months ago sits on an average cost basis of $89,200. For many of these participants, the return to these price levels offers a long-awaited opportunity to exit the market without a capital loss. The degree to which new buyers can absorb the selling pressure from these returning holders will be a decisive factor in whether Bitcoin can sustain a move above $90,000. If the market witnesses a "breakeven bounce"—where sellers overwhelm buyers at these specific cost bases—a temporary retracement could occur as the market "cleanses" the remaining weak-hand supply.

Valuation Bands and Historical Extremes
The institutional perspective, provided by asset management firm Bitwise, suggests that Bitcoin is entering a territory that is historically "stretched." Bitwise tracks several key cost-basis thresholds to identify "risk-on" conditions. Currently, Bitcoin has reclaimed all major tracked levels, including the short-term holder (STH) cost basis near $73,000, the true market mean at $77,000, and the estimated average cost basis for spot exchange-traded fund (ETF) investors at $83,000.
However, the firm’s valuation models indicate that the $90,000 to $95,000 range represents a significant deviation from the mean. The $90,000 level sits approximately 1.5 standard deviations above the realized price, a threshold Bitcoin has historically traded above only 3.8% of the time. Moving further, the $95,000 level represents a two-standard-deviation move, an extreme reached on only 1.7% of historical trading days.
Bitwise also utilizes a Fibonacci framework that identifies $92,000 and $100,000 as critical structural reference points. The convergence of these technical markers with the on-chain cost bases of underwater holders creates a "confluence zone" of resistance. Analysts suggest that while the momentum is undeniably bullish, the air is becoming thinner as the asset enters these historically rare valuation bands.
Derivative Markets and the Rebuilding of Leverage
The move toward $90,000 is also being fueled by a resurgence in the derivatives market. After a period of deleveraging at the end of September, where open interest fell to roughly $52 billion, speculative activity has begun to rebuild. In the first two days of October, Bitcoin’s open interest climbed to $56.2 billion, a $4.2 billion increase that coincided with the price rise from $83,500 to over $87,000.
This buildup of leverage indicates that traders are once again positioning for volatility. While rising open interest suggests new capital is entering the market, it also increases the risk of "long squeezes" if the price fails to break through resistance. Funding rates—the cost of maintaining long positions—have begun to rise, making it more expensive for bulls to hold their ground.
Positioning in the options market further reinforces the $90,000 to $100,000 target. Data from the Deribit exchange shows a massive concentration of call options at these strikes:
- $90,000 Strike: Approximately $2.1 billion in call exposure.
- $95,000 Strike: Approximately $2.4 billion in call exposure.
- $100,000 Strike: Approximately $1.8 billion in call exposure.
This "gamma wall" suggests that professional traders and hedgers are heavily focused on this price corridor. As Bitcoin approaches these strikes, market makers who have sold these calls may be forced to buy the underlying asset to hedge their positions, potentially creating a "gamma squeeze" that accelerates the upward move.
Macroeconomic Catalysts: The US Labor Market and Federal Reserve Policy
While internal crypto metrics are showing strength, the broader macroeconomic environment has provided a necessary tailwind. The release of the US employment report for September provided a significant "risk-on" catalyst. US employers added only 29,000 jobs during the month, falling far short of the 90,000 additions forecasted by economists. Additionally, the unemployment rate ticked up to 4.2%, and previous months’ data were revised downward.
In a traditional economic sense, a weak jobs report is negative; however, for risk assets like Bitcoin, it signals that the Federal Reserve’s restrictive monetary policy is cooling the economy, potentially necessitating a more aggressive pivot toward interest rate cuts. Following the data, futures markets lowered the probability of further rate hikes, with many participants now betting on a more accommodative stance from the Fed in the fourth quarter.
Lower interest rates typically lead to a weaker US Dollar and lower Treasury yields, both of which are historically correlated with higher Bitcoin prices. This macro shift has removed an immediate hurdle for the rally, allowing Bitcoin to capitalize on its internal bullish momentum without the drag of a hawkish central bank narrative.
Strategic Support Levels and Downside Risks
Despite the prevailing optimism, analysts warn that the path to $100,000 is unlikely to be linear. If Bitcoin fails to absorb the returning supply at the $88,000–$90,000 level, the market will look for support at lower realized-price bands.
The most critical downside level currently sits at $83,000. This is the estimated average cost basis for the wave of investors who entered the market through spot Bitcoin ETFs earlier this year. Maintaining price action above this level is vital for market sentiment; if the average ETF buyer falls back into a loss, it could trigger a wave of institutional outflows and a broader correction.
Secondary support is found at the $77,000 true market mean and the $73,000 short-term holder cost basis. As long as Bitcoin remains above these structural anchors, the "macro" trend remains bullish. However, the current "stretch" in valuation suggests that the market may require a period of consolidation or a "cooling off" of derivative leverage before a sustained breach of the $100,000 milestone can be achieved.
In conclusion, the convergence of thinning sell-side liquidity, rare accumulation patterns, and a favorable macroeconomic backdrop has positioned Bitcoin for a historic test of the $90,000 level. While the "underwater" supply from previous cycles and historically high valuation bands present significant hurdles, the massive positioning in the options market and the rebuilding of speculative interest suggest that the market is preparing for a high-stakes attempt to redefine Bitcoin’s price ceiling.