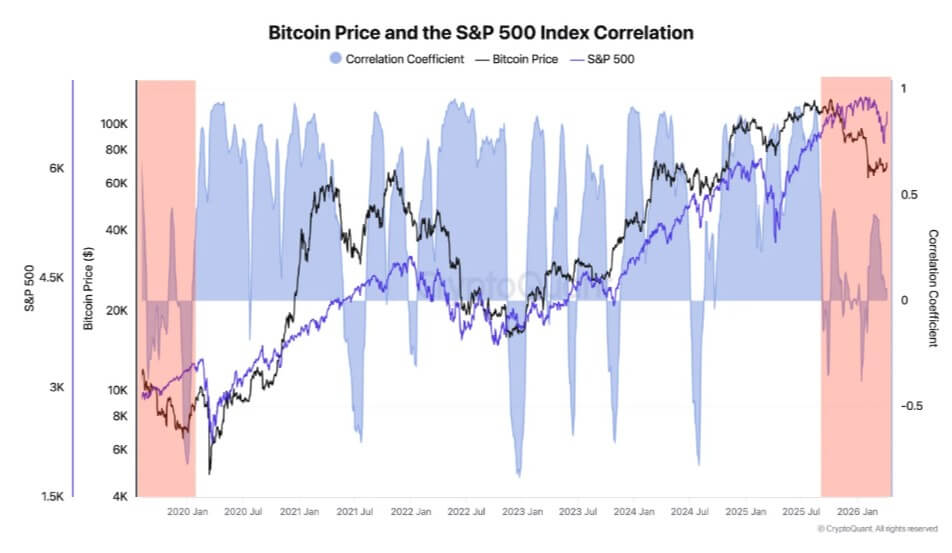
The global financial landscape is currently witnessing a stark divergence between traditional equities and digital assets, a phenomenon that has upended long-standing assumptions about market correlation. While the S&P 500 and the Nasdaq Composite have staged a historic recovery, surging to unprecedented heights and shaking off weeks of geopolitical instability, Bitcoin remains entrenched in a period of relative stagnation. This decoupling represents one of the most significant shifts in market dynamics since 2020, as the flagship cryptocurrency fails to capitalize on the "risk-on" sentiment that has added trillions of dollars to the valuation of Wall Street’s largest firms.
In a week characterized by a return to aggressive buying, the S&P 500 closed higher by 0.8%, pushing the benchmark index to a record-breaking 7,022.95. This milestone effectively eclipses the previous peak established in late January and signals a definitive end to the volatility that plagued the first quarter of the year. In contrast, Bitcoin continues to trade in a restricted range between $74,000 and $76,000, remaining approximately 40% below its previous all-time high of $126,000. For investors who have viewed Bitcoin as a high-beta proxy for the stock market, the current lack of synchronization is both a statistical anomaly and a source of growing concern regarding the asset’s internal liquidity.
The Mechanics of the Historic Equity Surge
The velocity of the recent stock market recovery has been described by institutional analysts as a "momentum thrust," a rare technical event that typically signals the start of a prolonged bullish cycle. Following a turbulent March, where the S&P 500 plummeted nearly 10% to a local bottom of 6,316.91, the index has undergone a dramatic reversal. This recovery occurred against a backdrop of severe geopolitical anxiety, including the US-Israel-Iran conflict and the resulting shocks to global oil prices.
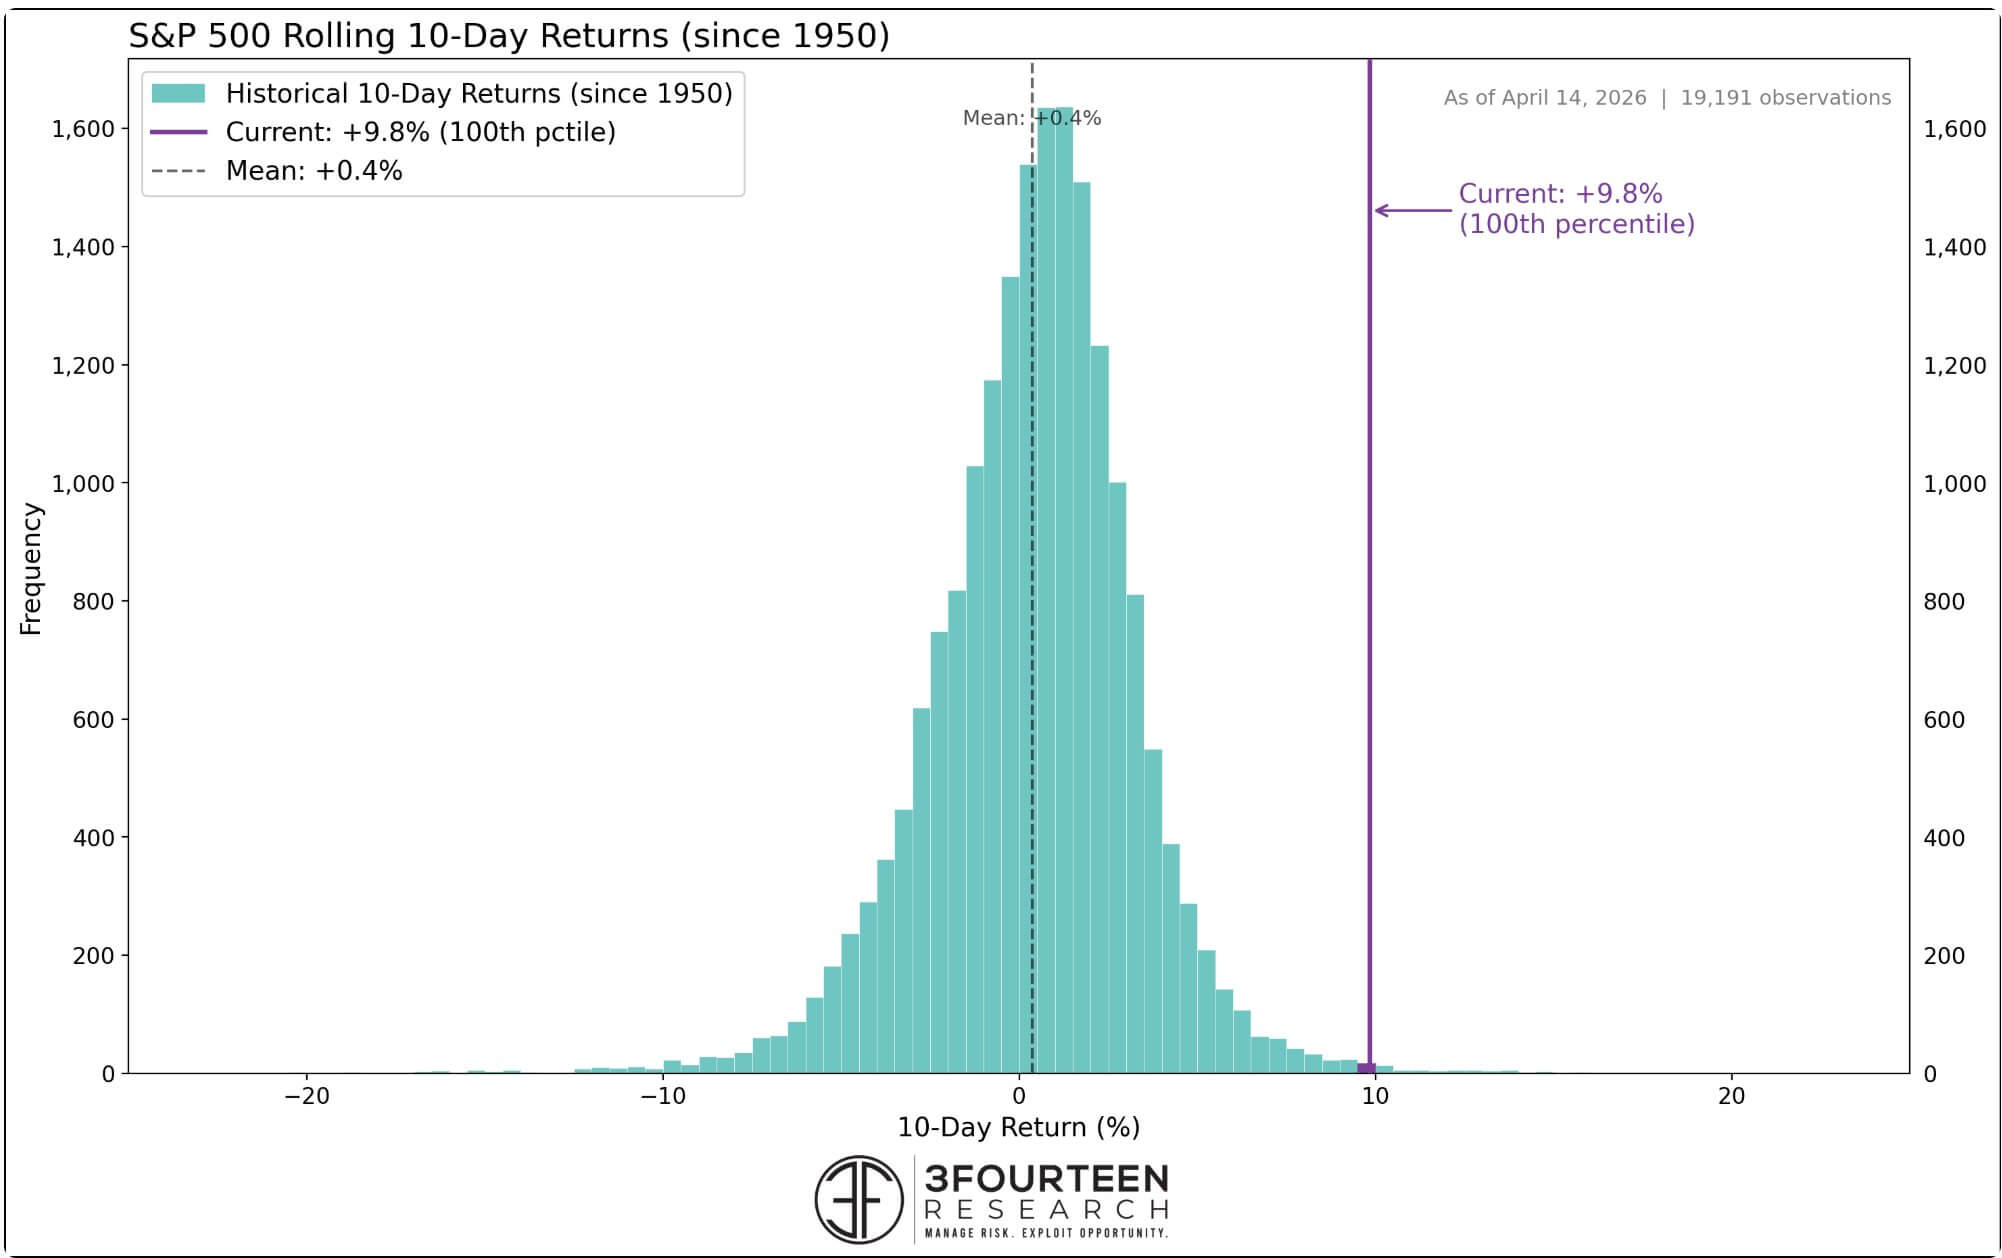
According to Warren Pies, the founder of 3F Research, the market’s trajectory over the last ten trading days is situated in the 99.7th percentile of all historical 10-day returns. Since 1950, there have been only 20 recorded instances of such aggressive short-term gains. Historically, these momentum thrusts have occurred primarily during deep bear markets when indices were at least 20% below their peaks. The current rally is unique because it is occurring while the market is already near all-time highs, suggesting a level of institutional confidence that is seldom seen in financial history.

The primary driver of this equity surge has been the "AI-Infrastructure" narrative. Large-cap technology stocks, often referred to as the "Magnificent 7," have reclaimed their market dominance with staggering efficiency. Since the March 30 lows, a fund tracking these mega-cap entities has surged by nearly 18%, significantly outperforming the broader market. Sector leaders such as Oracle and Nvidia have been positioned by analysts as the primary engines of global productivity growth, attracting massive capital inflows that might have otherwise found their way into speculative digital assets.
Chronology of the Market Reversal: March to April
The transition from extreme fear to record-breaking greed occurred over a remarkably short timeline. At the end of March, global markets were reeling from the threat of a prolonged conflict in the Middle East. The potential for a blockade in the Strait of Hormuz led to a spike in energy prices, fueling fears that inflation would remain "sticky" and force the Federal Reserve to maintain higher interest rates for longer than anticipated.
However, by the second week of April, the narrative shifted. Diplomatic efforts led to a temporary ceasefire and a de-escalation of tensions in the Persian Gulf. This geopolitical relief coincided with the release of the U.S. Producer Price Index (PPI) data for March. The PPI came in at a modest 0.1%, well below consensus expectations. This data point was a critical catalyst for the markets, as it suggested that the U.S. economy remained resilient and that the energy-driven inflation spikes were transitory.
As the Nasdaq Composite celebrated a 10-day winning streak—its longest since late 2021—traditional investors pivoted back into growth stocks. Between March 30 and mid-April, the market added over $6 trillion in capitalization. Yet, as the "Greed" index on Wall Street hit new highs, the cryptocurrency market failed to follow suit, leading to the longest period of weak correlation between Bitcoin and the S&P 500 in over four years.
Bitcoin’s Internal Struggles and Capital Outflow
While traditional markets are awash in new liquidity, on-chain data reveals a different story for the digital asset sector. According to Alex Adler, a senior analyst at CryptoQuant, Bitcoin is currently suffering from a severe lack of sustained capital inflow. The "Realized Cap" change—a metric that tracks the net capital moving into or out of the Bitcoin network—has been flashing warning signs for over three months.
Out of the first 105 days of 2026, only seven days recorded a positive 30-day Realized Cap change. Since late January, capital has been systematically exiting the Bitcoin network. Adler noted that without a reversal of this trend, a recovery to previous all-time highs is mathematically improbable. The outflow pressure peaked in late February and has only recently begun to slow. While the deficit has improved to -0.32%, the network still lacks the "compensating demand" required to push prices through heavy resistance levels.
This stagnation has led to what analytics firm Alphractal describes as a "complacency phase." Market sentiment for Bitcoin currently sits at a neutral-to-borderline bullish level. This is unusual given that the asset is trading 40% below its peak. Typically, such a large drawdown would be accompanied by extreme fear or "capitulation." The current state of complacency suggests that many retail investors are holding their positions but lack the conviction or capital to increase their exposure, leaving the price action to be dictated by institutional flows and automated trading desks.
Institutional Positioning and ETF Impact
Despite the sluggish price action, institutional interest in Bitcoin has not vanished; rather, it has become more calculated. Rachel Lucas, a crypto analyst at BTC Markets, pointed out that Bitcoin’s recent attempt to test the $76,000 level was supported by significant spot ETF inflows. In a single day in April, U.S.-based spot Bitcoin ETFs saw $411.5 million in net inflows, the second-largest figure for the month.
However, these inflows are being met with aggressive profit-taking. Data from Glassnode indicates that while ETF demand is improving, the broader market remains "twitchy." Investors are quick to sell into strength, preventing Bitcoin from establishing a foothold above its "Adjusted Realized Price" of $72,300. This metric represents the average break-even point for the current cohort of active investors. Reclaiming and holding this level is considered a prerequisite for any sustained bullish trend, as it serves as a psychological floor that discourages panic selling.
In the derivatives market, there are signs of a shift in risk appetite. Block Scholes reported that the heavy skew toward put contracts (downside protection) has begun to ease as Middle Eastern tensions subsided. Nevertheless, this reduction in fear has not yet translated into the aggressive "long" positioning required to trigger a breakout. The market is currently characterized by a dense cluster of leveraged liquidations stacked just above the $76,000 mark. If Bitcoin can clear this resistance, it could trigger a "short squeeze," forcing bearish traders to buy back their positions and potentially propelling the price toward the $80,000 range.
Implications and Market Outlook
The current decoupling of Bitcoin from the S&P 500 carries significant implications for the future of the digital asset class. For years, the narrative of Bitcoin as "digital gold" or a "non-correlated hedge" was challenged by its tendency to move in lockstep with tech stocks. The current divergence suggests that Bitcoin is maturing into an asset class with its own unique supply-and-demand dynamics, independent of the broader macro-environment.
However, this independence is currently a double-edged sword. While it protects Bitcoin from occasional downturns in the stock market, it also means the asset is not benefiting from the massive liquidity injections currently fueling the "AI supercycle" on Wall Street. Market-structure analysts at Bitunix suggest that Bitcoin is currently a "real-time test of risk absorption." The asset faces a formidable supply zone, and until it can demonstrate the ability to hold gains above $76,000, it will likely remain in a consolidation phase.
For the remainder of the quarter, the $70,000 level remains the critical support floor that institutional buyers are actively defending. A failure to hold this level could signal a deeper correction, whereas a sustained break above $76,000 would represent a meaningful structural shift. As Wall Street continues its historic run, the crypto market remains in a tense holding pattern, waiting for the capital inflows and narrative shift required to validate a new phase of price discovery. The coming weeks will determine whether Bitcoin can realign with the record-setting global markets or if this historic decoupling marks the beginning of a new, more fragmented era for digital finance.