James Watt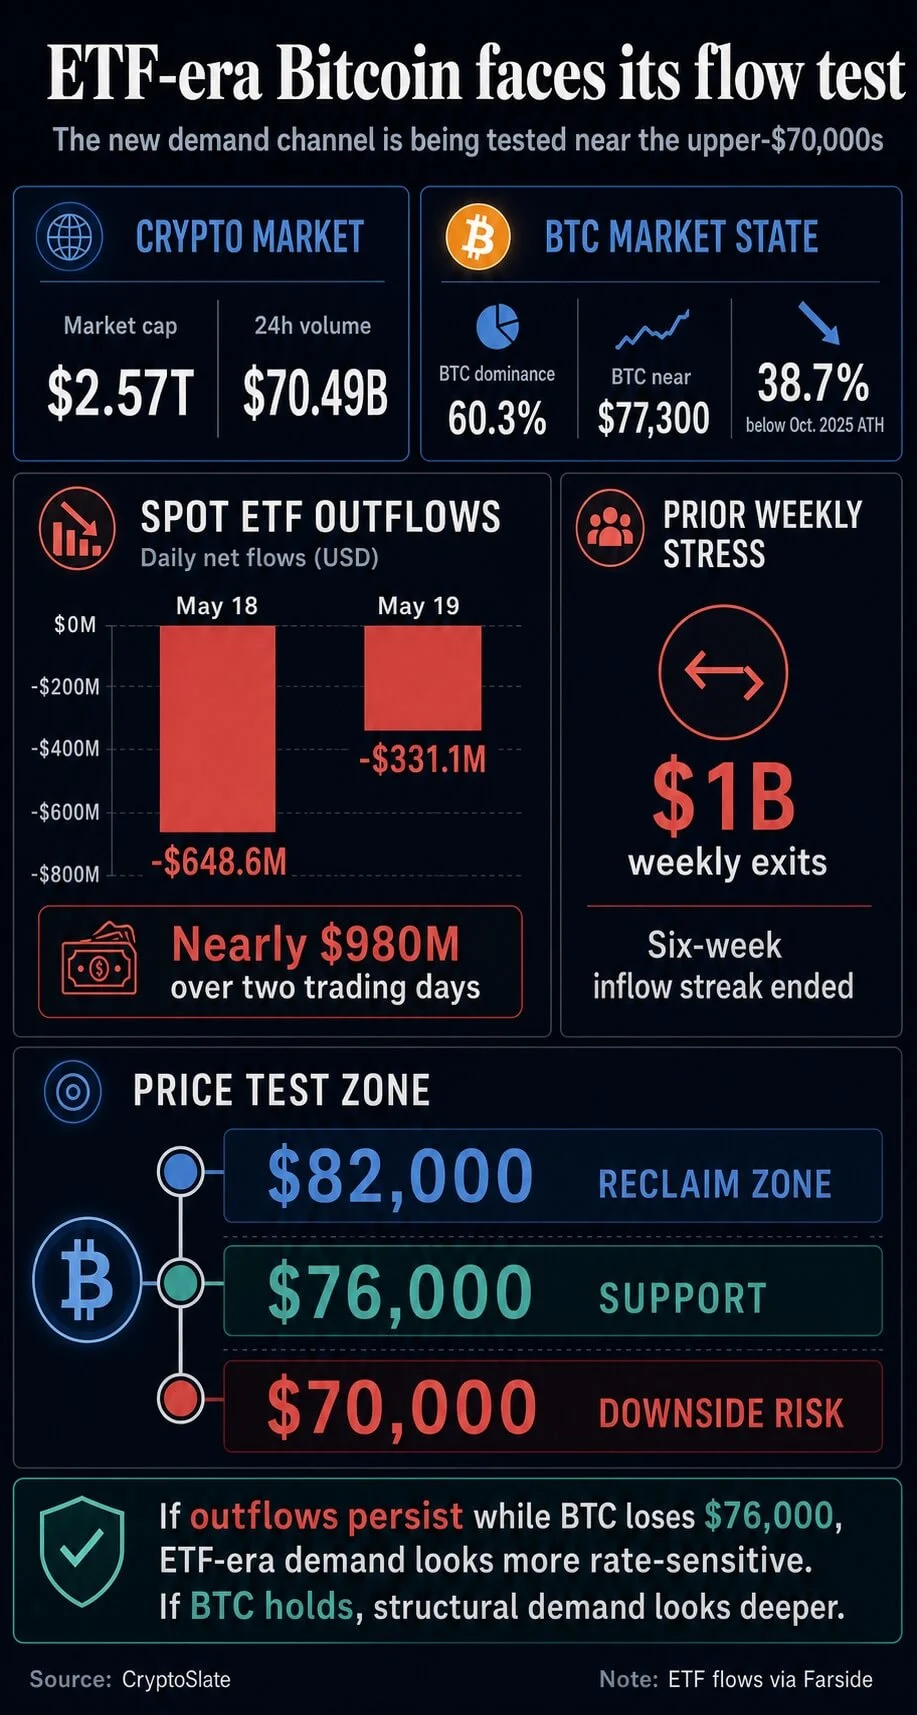
The global macroeconomic landscape for Bitcoin has undergone a fundamental shift in May 2026, transitioning from an environment of anticipated monetary relief to one pricing in a renewed threat of tightening. For much of the previous year, market participants had operated under the assumption that cooling inflation would eventually compel the Federal Reserve to lower interest rates, thereby increasing global liquidity and favoring risk-on assets. However, recent data from the CME FedWatch Tool and the U.S. Treasury market suggest that this "easier money" narrative is being replaced by a more restrictive outlook, placing significant pressure on Bitcoin’s current valuation and its role within institutional portfolios.
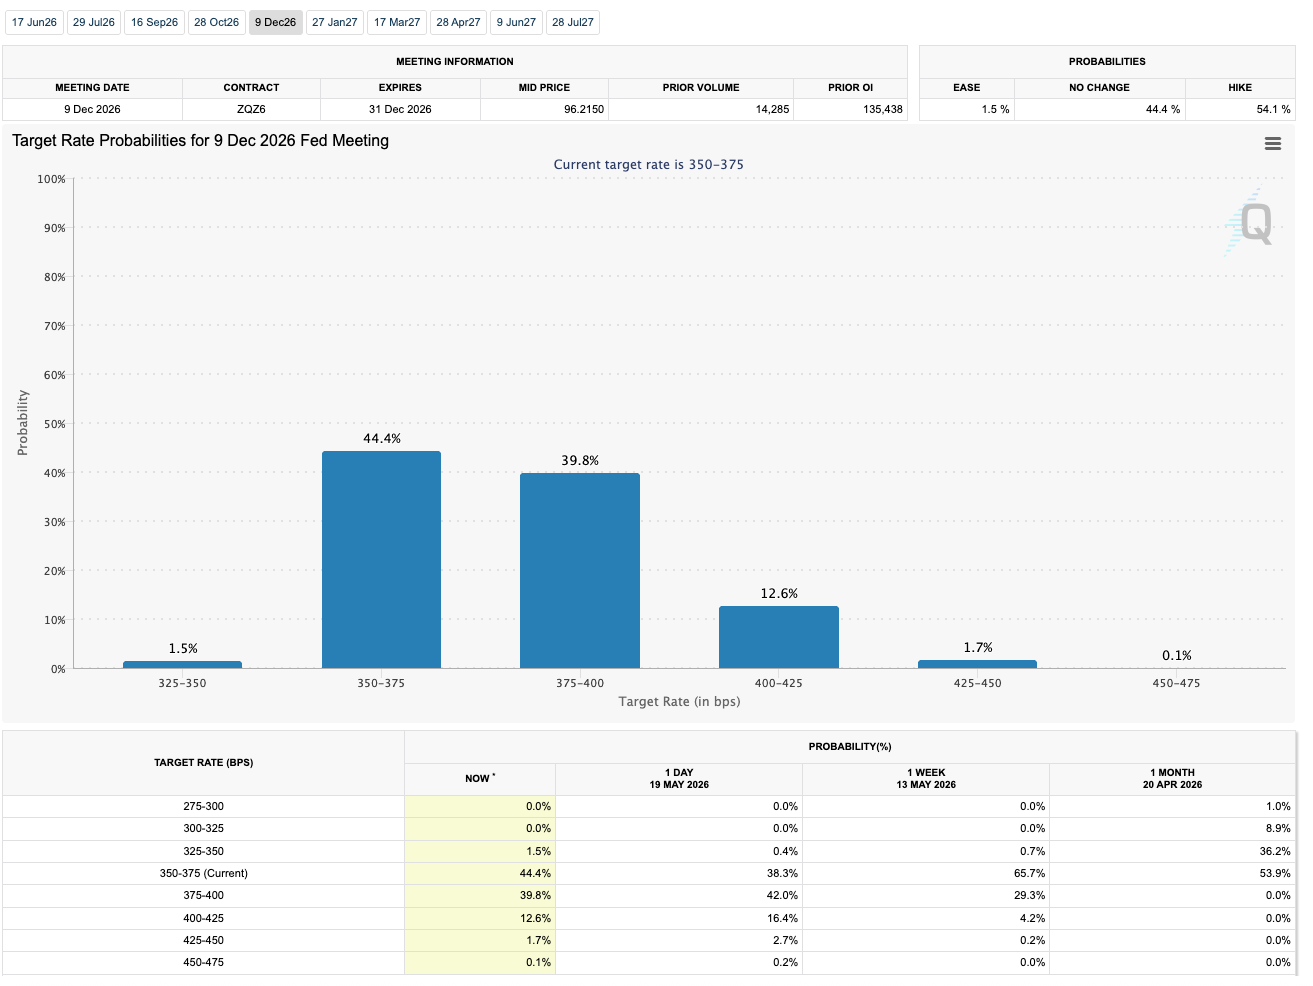
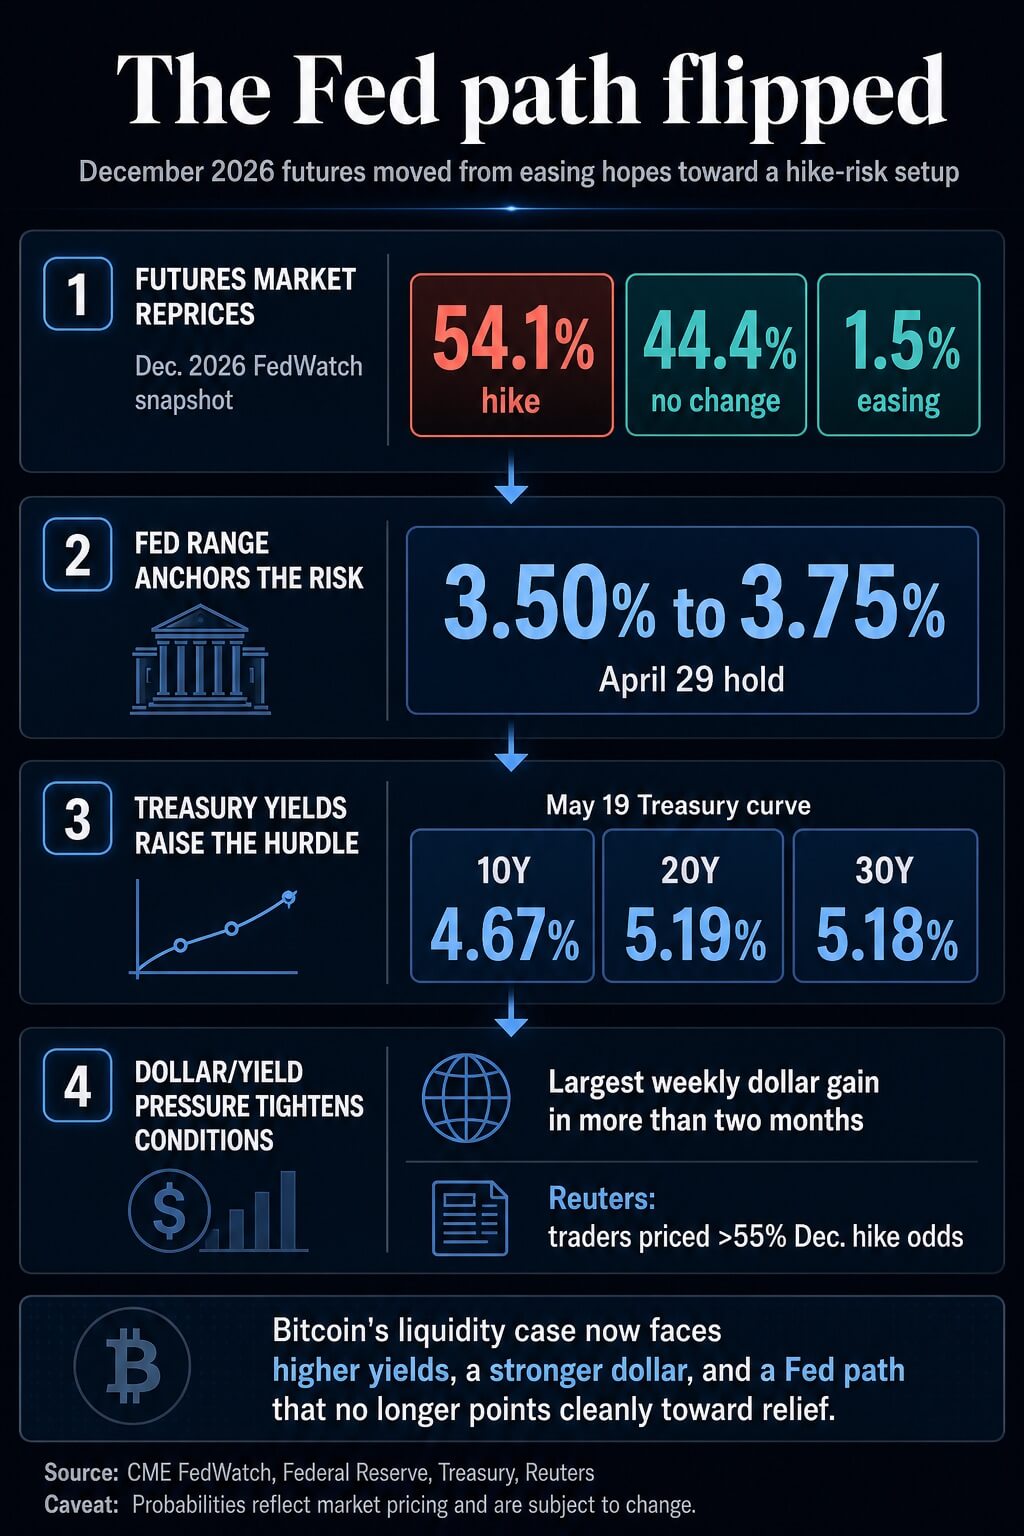
As of May 20, 2026, the CME FedWatch Tool indicated a 54.1% probability of a rate hike at the December 2026 Federal Open Market Committee (FOMC) meeting. This represents a stark departure from previous months, where easing was considered the most likely outcome. In contrast, the odds of the Fed maintaining the current rate stood at 44.4%, while the probability of a rate cut plummeted to a mere 1.5%. This shift in sentiment suggests that the market is no longer merely debating the timing of a pivot toward lower rates but is actively pricing in the possibility of further policy tightening to combat persistent inflationary pressures.
The Evolution of Federal Reserve Policy and the 2026 Anchor
To understand the current market tension, it is necessary to examine the Federal Reserve’s policy trajectory throughout the first half of 2026. On April 29, 2026, the central bank’s policy-setting committee elected to hold the target range for the federal funds rate at 3.50% to 3.75%. At the time, the decision was viewed as a "hawkish hold," a signal that while the Fed was pausing its hiking cycle, it was not yet ready to signal a transition to cuts.
The subsequent move in the futures market toward a 54.1% chance of a hike in December indicates that the April "hold" may have been the floor rather than the ceiling for this cycle. If the Federal Reserve proceeds with a hike from the 3.50%–3.75% range, it would mark a significant escalation in the cost of capital, directly impacting the discounted cash flow models of traditional assets and the opportunity cost of holding non-yielding assets like Bitcoin.
The shift in expectations has been fueled by a combination of resilient economic data and rising energy costs, which have kept headline inflation above the Federal Reserve’s 2% target. For Bitcoin investors, the "hard money" narrative—which posits that Bitcoin serves as a hedge against currency debasement—is currently being tested by the reality of a central bank that appears committed to maintaining a "higher for longer" interest rate environment.

Treasury Yields and the Strengthening Dollar: A Double Headwind
The repricing of Fed expectations has manifested clearly in the fixed-income markets. On May 19, 2026, the U.S. Treasury yield curve reflected a significant upward move, with the 10-year Treasury note yielding 4.67%. Longer-dated maturities followed suit, with the 20-year yield reaching 5.19% and the 30-year yield hitting 5.18%. These levels represent some of the most attractive risk-free returns available to investors in years, creating a high hurdle for volatile assets.
When government debt offers a guaranteed return of over 5%, the capital allocation math for institutional investors changes. The "equity risk premium"—the extra return investors demand for choosing stocks or crypto over "safe" Treasurys—shrinks. For Bitcoin, which pays no dividends or interest, the rise in yields acts as a direct gravitational pull, drawing capital away from the digital asset market and into the safety of the bond market.
Simultaneously, the U.S. dollar has demonstrated renewed strength. Reports indicate that the dollar is currently on track for its largest weekly gain in over two months. This appreciation is driven by the confluence of rising Treasury yields and a global flight to quality as traders digest the possibility of a December rate hike. Historically, Bitcoin has maintained a strong inverse correlation with the U.S. Dollar Index (DXY). A stronger dollar effectively tightens global financial conditions, reducing the amount of excess liquidity available to flow into speculative or alternative asset classes.
The Spot ETF Transmission Channel: A New Source of Sensitivity
The introduction of spot Bitcoin ETFs in early 2024 was heralded as a milestone for institutional adoption, providing a regulated and familiar entry point for brokerage accounts. However, this mainstreaming has also integrated Bitcoin more deeply into the traditional financial plumbing, making it more sensitive to the same macro forces that drive equities and bonds.
The "ETF era" of Bitcoin has created a transparent, daily scoreboard of institutional demand. Recent data suggests that this demand is highly sensitive to the shifting interest rate outlook. On May 18, 2026, U.S. spot Bitcoin ETFs recorded outflows totaling $648.6 million. This was followed by an additional $331.1 million in outflows on May 19, bringing the two-day total to nearly $980 million.
This trend follows a broader reversal in sentiment; earlier in the month, a six-week streak of inflows was broken by a $1 billion weekly exit. These flows suggest that the "marginal buyer" of Bitcoin—the investor who determines the price at the edge—is no longer the long-term "HODLer" but rather the institutional allocator who views Bitcoin through the lens of portfolio risk management. If the macro environment becomes unfavorable, these allocators are proving quick to rotate back into cash or defensive instruments.
Market Snapshot and Technical Support Levels
As of May 20, 2026, the aggregate cryptocurrency market capitalization stood at approximately $2.57 trillion, with a 24-hour trading volume of $70.49 billion. Bitcoin continues to maintain its dominance over the sector, accounting for 60.3% of the total market value. Despite this dominance, the price of Bitcoin has struggled to maintain its momentum.
Trading at approximately $77,300, Bitcoin is currently 38.7% below the all-time high it achieved in October 2025. Market analysts have identified the $76,000 to $77,000 range as a critical support zone. This area represents more than just a technical floor; it is the frontline of the macro test. If Bitcoin can hold this level despite rising yields and ETF outflows, it would suggest that structural demand remains robust enough to absorb significant selling pressure.
However, a failure to defend this support could open the door for a slide toward the $70,000 psychological level. On the resistance side, Bitcoin’s inability to reclaim the $82,000 mark has prevented the market from viewing the current dip as a routine consolidation. As long as the price remains below $82,000, the technical bias remains tilted toward the downside, especially given the fundamental headwinds provided by the Federal Reserve.
Chronology of the May 2026 Macro Shift
The current market state is the result of a series of events that unfolded over several weeks:
- April 29, 2026: The Federal Reserve holds the target range at 3.50%–3.75%, but issues a statement emphasizing that inflation remains "sticky."
- May 14, 2026: A key vote by CLARITY (a fictional or specific regulatory body/index mentioned in the context) impacts market sentiment, while Bitcoin trades above $81,000.
- May 18, 2026: Institutional sentiment sours as $648.6 million exits U.S. spot ETFs, coinciding with a rise in energy prices.
- May 19, 2026: Treasury yields spike across the curve; the 10-year yield hits 4.67%. Another $331.1 million leaves ETFs.
- May 20, 2026: CME FedWatch data confirms that a majority of the market (54.1%) now expects a rate hike in December, fundamentally altering the 2026 macro setup.
Broader Implications and Institutional Reactions
The reaction from the broader financial community has been one of cautious recalibration. While some digital asset proponents argue that Bitcoin’s fixed supply makes it the ultimate hedge against long-term fiscal instability, the short-term reality is governed by liquidity.
Market observers note that the "ETF wrapper" has essentially "normalized" Bitcoin. While this has brought in billions of dollars in new capital, it has also subjected the asset to the rigors of institutional allocation math. In this framework, Bitcoin is often treated as "high-beta" liquidity—an asset that outperforms when money is cheap and plentiful but is the first to be sold when the Fed tightens the screws.
The coming weeks will be pivotal in determining whether the recent ETF outflows are a temporary tactical adjustment or the beginning of a sustained trend. If the FedWatch probabilities remain elevated above 50% for a December hike, the pressure on Bitcoin is likely to persist. Conversely, if upcoming economic data—such as Consumer Price Index (CPI) or employment reports—shows signs of cooling, the market may quickly revert to pricing in relief, potentially allowing Bitcoin to reclaim its lost ground.
Conclusion: A Test of Resilience for the Digital Gold Thesis
Bitcoin’s 2026 journey has reached a crossroads. The transition from a "waiting for relief" phase to a "pricing a threat" phase represents a significant psychological shift for investors. For the first time since the launch of spot ETFs, the market is facing a sustained period where the Federal Reserve is actively considering further tightening rather than just delaying cuts.
The $76,000 to $77,000 price zone has become the proving ground for the "digital gold" thesis in a high-rate environment. If Bitcoin can stabilize here, it will demonstrate that its investor base has matured beyond simple liquidity chasing. If it fails, it will confirm that for all its technological innovation, Bitcoin remains deeply tethered to the global cost of the U.S. dollar. As the December FOMC meeting looms on the horizon, every basis point move in Treasury yields and every dollar of ETF flow will be scrutinized as a signal of Bitcoin’s place in the new macroeconomic order.