The cryptocurrency market reached a significant milestone on Wednesday as Bitcoin (BTC) surged to range highs exceeding $76,000, yet a growing consensus among leading on-chain analysts suggests that declaring the definitive start of a new bull market remains premature. Despite the optimistic price action, comprehensive data from Glassnode and independent market researchers indicate a persistent disconnect between the asset’s spot price and the underlying health of capital inflows. Throughout the first 105 trading days of 2026, Bitcoin’s growth rate has remained stubbornly negative, highlighting a period of stagnation in new demand that could potentially cap further upside in the near term.
The Profitability Gap and the True Market Mean
A primary concern for market observers is the "True Market Mean" (TMM), a sophisticated metric utilized by Glassnode analyst CryptoViz.art to assess the average cost basis of active investors. Unlike traditional market price averages, the TMM divides investor capitalization by the liveliness-adjusted circulating supply. By filtering out inactive or "lost" coins—including those held by Satoshi Nakamoto or in inaccessible wallets—the TMM provides a more accurate reflection of the entry points for participants currently active in the market.
According to the latest Glassnode data, Bitcoin crossed below the TMM threshold on January 31, 2026, and has remained beneath this level for 75 consecutive days. This technical positioning suggests that the average active investor is currently holding a position at a loss. At its lowest point during this period, the market saw a peak drawdown of 20% relative to the TMM. While the recent price rally to $76,000 has narrowed this gap to approximately 5%, the TMM currently sits at $78,013. Until Bitcoin convincingly reclaims this level, the market remains in a phase where sell-side pressure from investors seeking to "break even" could hinder sustained upward momentum.
Historical analysis of previous cycles offers a sobering perspective on the current 75-day duration. Since 2016, there have been ten similar instances where the price broke below the TMM. These episodes have varied wildly in duration, lasting from as little as two days to as long as eleven months. Notably, the major bear market cycles of 2018–2019 and 2022–2023 saw drawdowns reaching 57%. In the 2018 and 2022 episodes, the market did not reach a definitive bottom until months five through nine. CryptoViz.art notes that while the current recovery is underway, the 75-day mark is still early in the context of historical recovery timelines, suggesting that market participants should remain cautious rather than assuming an "all-clear" signal.

Capital Outflows and the Realized Cap Ceiling
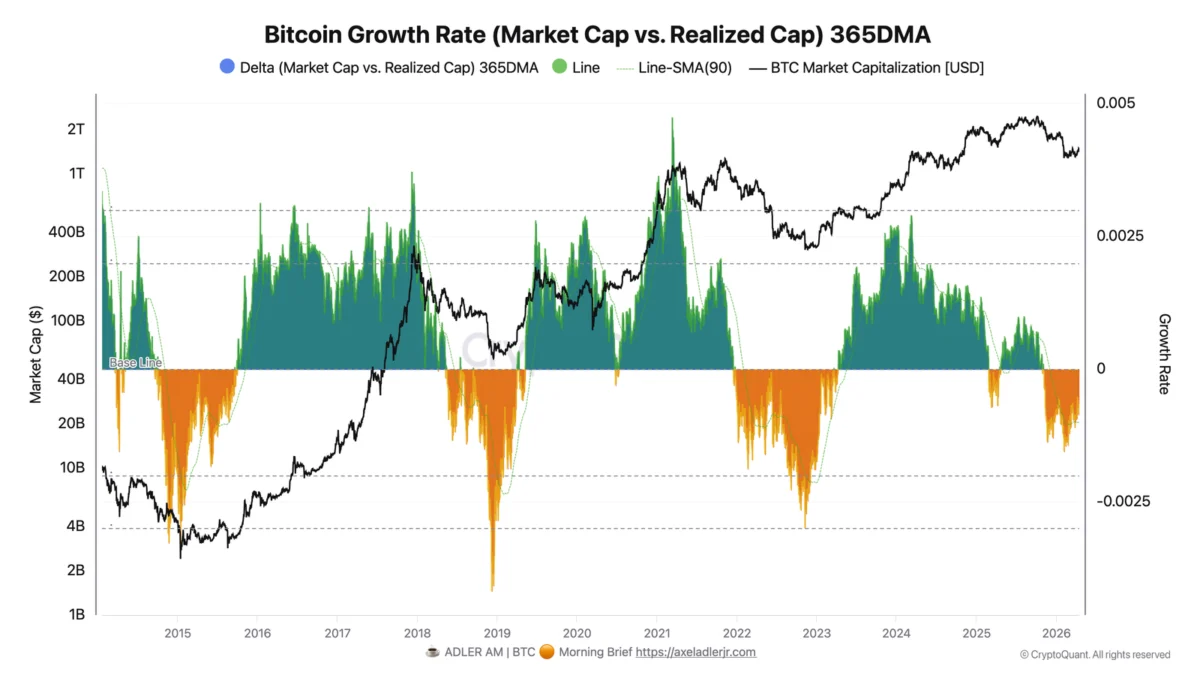
Complementing the profitability data is an analysis of capital movement within the network. Bitcoin researcher Axel Adler Jr. has identified a persistent trend of capital exiting the market, which creates a formidable ceiling for price discovery. A critical metric in this regard is the 365-day growth rate of the market capitalization relative to the realized capitalization. This ratio serves as a barometer for new money entering the ecosystem.
For the entirety of 2026—totaling 105 trading days—this growth rate has remained in negative territory. The most recent reading of -0.000652 underscores a fundamental lack of fresh liquidity. In a typical bull market, this metric turns sharply positive as new retail and institutional investors buy into the asset, driving the realized cap higher. However, the current data suggests that the recent price increase is driven more by low liquidity and existing holder positioning rather than a surge of new participants.
The 30-day change in realized capitalization further illustrates this struggle. Realized capitalization, which values each Bitcoin at the price it last moved, has dropped from $1.12 trillion at the start of the year to $1.08 trillion, representing a 3.23% decline. Within the 2026 calendar year, only seven days have seen positive net inflows, all clustered during a brief window in mid-January. Since January 23, the metric has been consistently negative. While there has been a slight recovery from the early April lows of -0.54% to the current -0.32%, Adler Jr. emphasizes that this represents a "slowdown in outflows" rather than a "bullish reversal." A true shift in market structure would require both the 365-day and 30-day metrics to flip positive and remain above zero for a sustained period.
Chronology of the 2026 Market Performance
To understand the current precariousness of the Bitcoin market, it is necessary to examine the timeline of events that have shaped the first four months of 2026:
- January 1–15, 2026: The year began with a brief moment of optimism. Institutional interest appeared to spike, leading to seven days of positive capital inflows. During this window, Bitcoin’s realized cap hovered near its yearly high of $1.12 trillion.
- January 23, 2026: The trend reversed. Capital began leaving the network at a steady pace, marking the start of a 105-day streak of negative growth in the market-to-realized cap ratio.
- January 31, 2026: Bitcoin price fell below the True Market Mean. This event signaled that the average active participant had entered a state of unrealized loss, shifting the market psychology from "profit-taking" to "loss mitigation."
- February – March 2026: The market entered a period of consolidation. While spot prices remained relatively stable compared to previous bear markets, the underlying on-chain metrics continued to deteriorate, with realized cap steadily eroding.
- Early April 2026: Outflows reached a local peak, with the 30-day realized cap change hitting a low of -0.54%. Sentiment reached a period of extreme caution among on-chain analysts.
- Wednesday, April 2026: Bitcoin price hit range highs above $76,000. Despite the price surge, the TMM remained at $78,013, leaving the asset roughly 5% shy of the critical "profitability reclaim" level.
Institutional Influence and ETF Dynamics
The divergence between price and on-chain capital flows is partly explained by the changing nature of Bitcoin ownership. The rise of spot Bitcoin Exchange-Traded Funds (ETFs) has introduced a layer of "off-chain" demand that is not immediately reflected in traditional on-chain metrics like realized cap.

Recent reports highlight that Morgan Stanley’s Bitcoin fund has recently overtaken the WisdomTree Bitcoin Fund after just six trading days of significant activity. This institutional reshuffling suggests that while capital may be rotating within the traditional financial sector, it has not yet resulted in a massive net increase in the total amount of "stored value" within the Bitcoin network itself.
Furthermore, prominent figures in the space, such as Blockstream CEO Adam Back, have recently discussed the long-term technical evolution of the network. Back noted that Bitcoin’s eventual migration to post-quantum cryptographic standards could inadvertently reveal the true extent of "Satoshi’s stash"—the approximately 1.1 million BTC held by the network’s creator. Such discussions, while technical, highlight the market’s focus on long-term supply dynamics. If a significant portion of "lost" supply is eventually moved or accounted for differently, the calculations for TMM and other cost-basis metrics could shift, potentially altering the perceived "fair value" of the asset.
Implications for Market Participants
The current data suggests a "wait-and-see" approach for sophisticated investors. The primary implication of the negative capital growth rate is that the current price rally lacks a "safety net." In a high-inflow environment, price drops are often met with aggressive buying from new participants. In the current "outflow" environment, price spikes are often driven by short-coverings or low-volume trading, making them susceptible to rapid reversals if a large holder decides to liquidate.
For the bull market to be officially confirmed by on-chain standards, two primary conditions must be met:
- Reclaiming the TMM: A sustained daily close above $78,013 would signal that the average active investor is back in profit. Historically, this has acted as a "momentum reset," where holders become less likely to sell at the first sign of trouble.
- Positive Realized Cap Growth: The 30-day and 365-day capital flow metrics must return to positive territory. This would indicate that "new money" is finally outweighing the "old money" exiting the system.
Broader Economic Context
The struggle to attract new capital into Bitcoin comes at a time of broader macroeconomic uncertainty. While Bitcoin has often been touted as "digital gold," its performance in 2026 has been closely tied to global liquidity cycles. High interest rates in major economies have increased the opportunity cost of holding non-yielding assets, potentially explaining why capital inflows have remained weak despite the $76,000 price tag.

The disparity between price and demand also raises questions about the efficiency of the current market. If Bitcoin continues to rise toward $80,000 without a corresponding increase in realized cap, the "bubble risk" increases, as the price would be supported by a shrinking base of actual invested capital. Conversely, if the realized cap begins to rise while the price stays flat, it would represent a "coiling" effect, often preceding an explosive move to the upside.
In conclusion, while the headline price of $76,000 is undoubtedly a show of strength for Bitcoin, the underlying mechanics of the network tell a more complex story. The 75-day stay below the True Market Mean and the 105-day streak of negative capital growth serve as vital reminders that price action alone does not define a bull market. Analysts remain focused on the $78,013 level and the reversal of capital outflows as the true indicators of the next major market phase. Until these metrics align, the current rally remains a high-altitude climb on thin air.