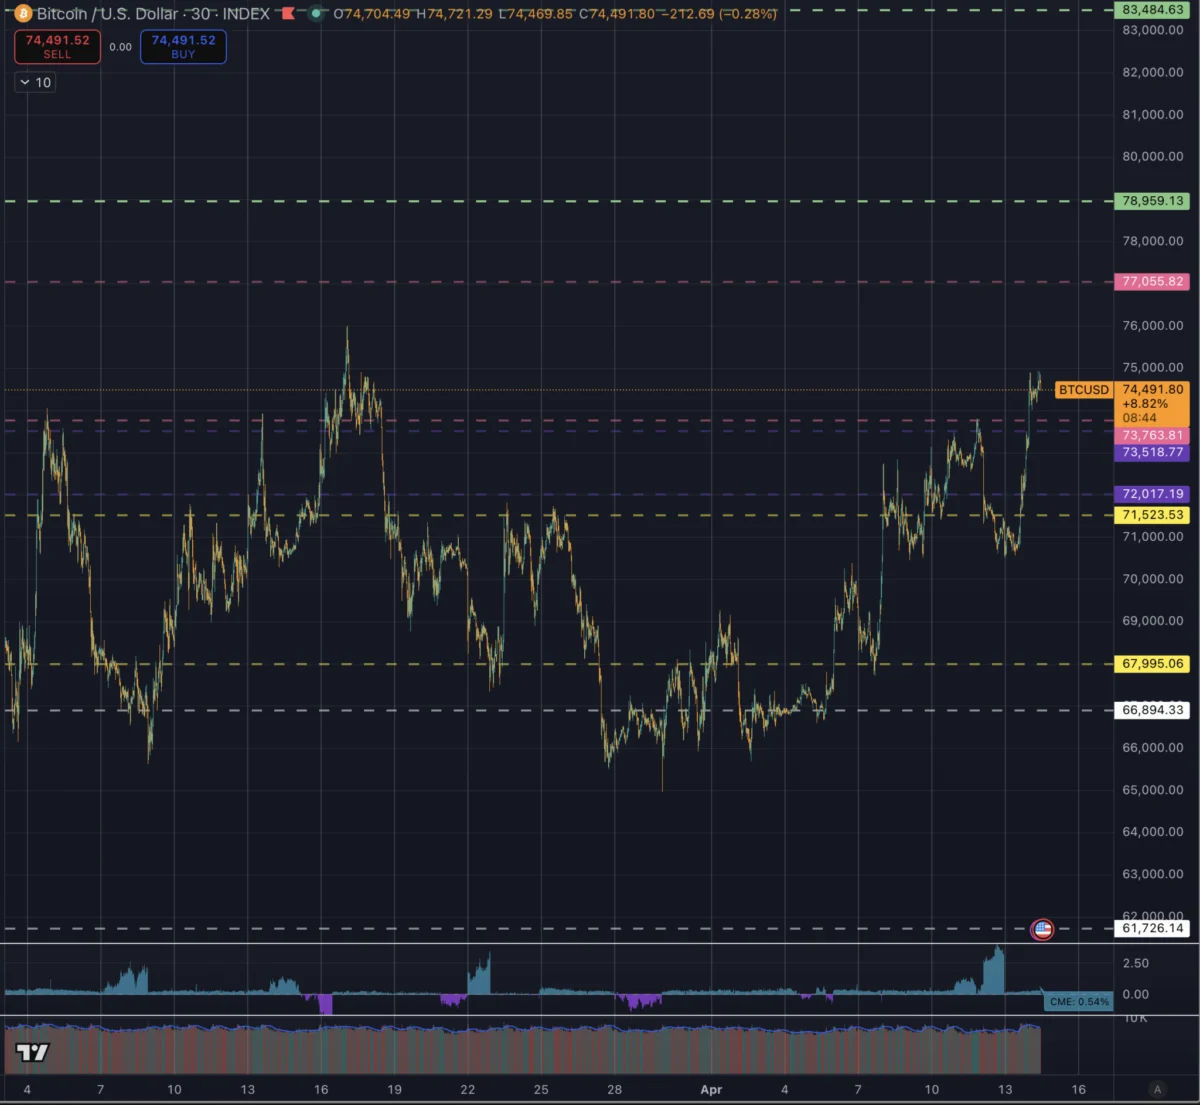
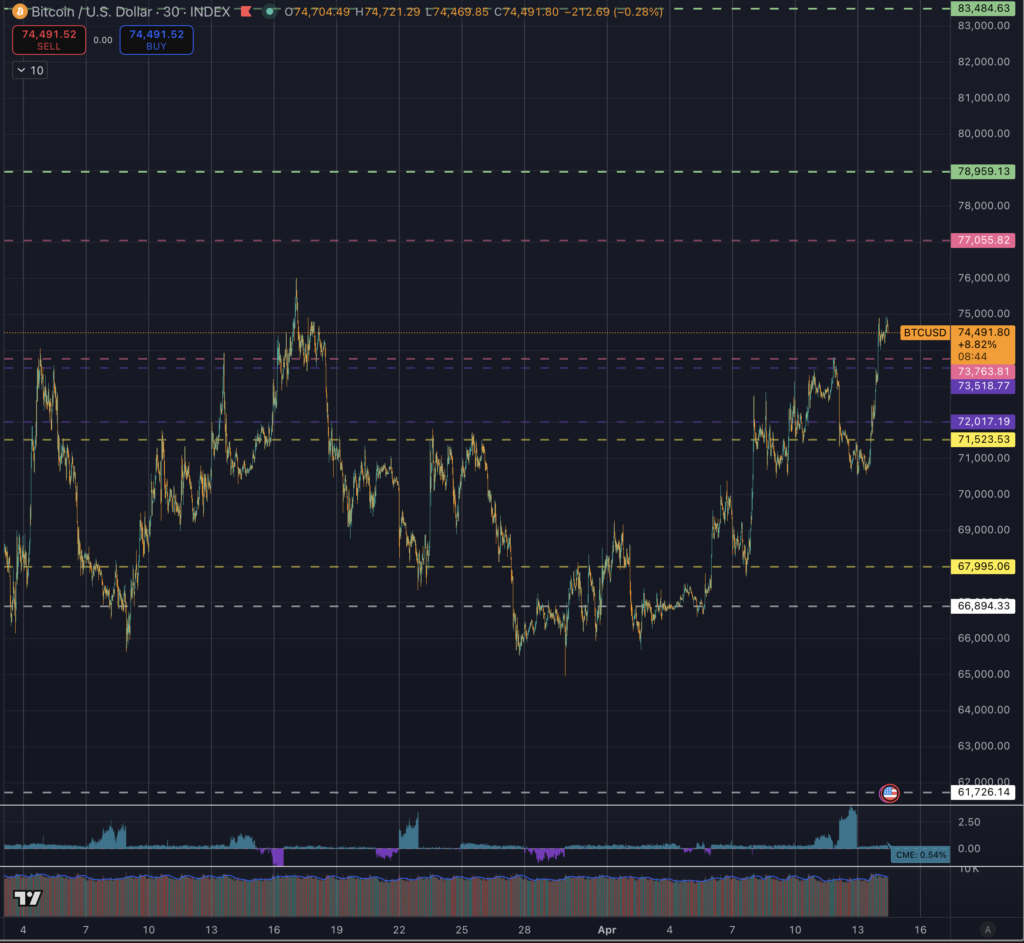
The global cryptocurrency market reached a significant milestone over the last 48 hours as Bitcoin (BTC) decisively breached the $71,500 resistance level, a ceiling that had previously stifled multiple rally attempts throughout the early months of the year. This latest price action saw the premier digital asset not only reclaim the $72,000 mark but also penetrate the critical $73,500 to $73,800 resistance pocket—a zone that historically represented the asset’s previous all-time high (ATH). As of the latest intraday data, Bitcoin traded near $74,485, having printed a session high of approximately $74,947. This movement represents a 5.2% increase over a 24-hour period and a 4.1% gain over 48 hours, effectively shifting the market’s focus from resistance-testing to support-validation.
A Structural Shift in Price Action
The recent surge is being characterized by market analysts not as a routine "green day" but as a fundamental structural shift in Bitcoin’s price architecture. For much of 2024, Bitcoin’s price action was defined by a series of failed attempts to secure follow-through above the $71,500 mark. These repeated rejections often led to increased pressure on lower support levels, as momentum appeared to thin with each subsequent retest. However, the current breakout suggests a change in market conviction.
Bitcoin’s movement through the "ladder" of resistance levels—$71,523, then $72,017, and finally the $73,518 to $73,764 zone—was methodical rather than erratic. By clearing these levels sequentially, the market reduced the immediate supply burden, allowing the price to enter a state of "price discovery" above its former peak. The total market capitalization for Bitcoin now stands at approximately $1.49 trillion, supported by a 24-hour trading volume of $55.34 billion, indicating robust liquidity behind the move.
Chronology of the Breakout
The path to $74,947 was paved by several months of consolidation and localized volatility. To understand the significance of the current price, one must look at the timeline of events leading up to this week:
- February – March 2024: Bitcoin established a firm ceiling at $71,500. Despite high buying interest, the market lacked the sustained conviction to turn this resistance into support. Every approach to the $71k range was met with aggressive selling.
- Late March 2024: The market entered a period of "ominous" sideways action. Analysts noted that failing to break $71,500 seven times was a signal of underlying exhaustion, leading to fears of a deeper correction toward the $60,000 range.
- Early April 2024: Macroeconomic factors, including geopolitical tensions in the Middle East and fluctuating energy prices, kept Bitcoin pinned within a defensive range. The asset fluctuated between $66,000 and $70,000.
- The Last 48 Hours: A confluence of easing macro pressures and technical momentum allowed Bitcoin to slice through the $71,500 barrier. Within 24 hours, the price jumped from $70,685 to nearly $75,000, effectively clearing the "old ATH band."
The Macroeconomic Backdrop: Oil, Inflation, and Equities
Bitcoin’s breakout did not occur in a vacuum. It was closely mirrored by movements in the broader financial landscape, specifically in the equities and energy markets. Analysts have noted a high correlation between Bitcoin and high-beta risk assets during this cycle.

A primary driver for the improved risk sentiment was the stabilization of the oil market. Earlier in the month, Brent crude prices surged above $100 per barrel following reports that the United States intended to block Iranian ports and amid renewed tensions surrounding the Strait of Hormuz. High energy prices typically stoke inflation fears, which in turn prompts the Federal Reserve to maintain a hawkish stance, a scenario generally bearish for Bitcoin. However, as diplomatic efforts re-entered the conversation, oil prices eased from their peaks, providing a "relief rally" for both stocks and crypto.
Simultaneously, the release of U.S. Consumer Price Index (CPI) data for March provided a nuanced picture for investors. Headline inflation rose 3.3% year-over-year, largely driven by energy costs. However, core CPI—which excludes volatile food and energy prices—increased by 0.2% on the month and 2.6% on the year. This softer-than-expected core figure suggested that the energy shock had not yet fully permeated the broader economy, giving the S&P 500 and Bitcoin room to expand.
Technical Analysis: Reclaiming Support
With the $71,500 ceiling now in the rearview mirror, the technical task for Bitcoin has shifted from "reclaim" to "acceptance." In market technicals, acceptance occurs when an asset stays above a previous resistance level long enough for it to function as a new floor, or support.
The current market framework identifies several key layers:
- The Immediate Support Band ($73,518 – $73,764): This is the most critical zone. If Bitcoin can maintain its position above this range during the next retracement, it confirms that the breakout has "depth" and is not merely a "fake-out."
- The Secondary Shelves ($72,017 – $71,523): Should the upper band fail to hold, these levels act as the next line of defense. A dip into this region that results in a bounce would still be considered a "constructive" reset.
- The Upside Targets ($77,056 – $78,959): These are the next major historical resistance bands. If the $73.5k–$73.8k floor holds, analysts expect Bitcoin to probe $77,056 in the near term.
The transition from $73,800 to $77,000 represents the next "ladder" in the asset’s progression. Market experts suggest that a slow approach to these targets, characterized by periods of consolidation, would be healthier for the long-term trend than a vertical spike, which often leads to blow-off tops.
Market Reactions and Institutional Implications
While official statements from major financial institutions regarding daily price fluctuations are rare, the sentiment among institutional traders appears cautiously optimistic. The successful breach of the $74,000 level is expected to trigger algorithmic buying programs that key off of "all-time high" breakouts.
Furthermore, the role of spot Bitcoin ETFs (Exchange-Traded Funds) cannot be overlooked. The consistent inflow of capital into these instruments provides a steady bid that was absent in previous cycles. As Bitcoin negotiates inside a zone that previously rejected price, the presence of institutional "diamond hands"—investors with a longer-term horizon—may provide the stability needed to turn $73.7k into a permanent floor.
Industry observers note that the current environment is a test of "hubris versus reality." Earlier predictions that Bitcoin would reach $79,000 this year are now being revisited as plausible scenarios rather than speculative outliers. The asset has demonstrated that it remains a high-beta expression of global liquidity; when macro pressures ease, Bitcoin is often the first to leap into new territory.
Future Outlook and Risk Factors
Despite the bullish breakout, several risks remain on the horizon. The primary threat to Bitcoin’s current trajectory is a potential reversal in the macro environment. If geopolitical tensions in the Middle East escalate again, leading to a sustained spike in oil prices above $110, the resulting inflationary pressure could force the Federal Reserve to reconsider interest rate cuts. Such a "tightening" of the external environment has historically forced Bitcoin back into lower trading channels.
Additionally, the market must contend with the "pain of the gain." Large-scale liquidations of short positions during the move to $74,947 have cleared out one side of the trade, but a rapid ascent often leaves "gaps" in support. Traders will be watching the $71,500 level closely; if Bitcoin slices back through this band and begins trading below it again, the breakout phase would be viewed as increasingly fragile, potentially signaling a "bull trap."
In conclusion, Bitcoin has successfully climbed the resistance ladder that defined the first quarter of the year. By reclaiming $71.5k and pushing into the $74k range, the market has entered a new phase of price discovery. The near-term task is no longer about breaking through a ceiling, but about building a solid floor. Whether the market can remain above the old ATH long enough to turn this breakout into a base will likely define the trend for the remainder of the quarter. If the support holds, the path toward $77,000 and $79,000 appears fundamentally open.