Bitcoin has demonstrated a decisive return to bullish form, surging more than 5% during Tuesday’s trading session to reach an intraday high of $76,120. This price action represents a significant milestone for the world’s largest cryptocurrency, marking its highest valuation in 70 days. The rally has not only cleared immediate technical hurdles but has also reinvigorated market expectations for a sustained climb toward the $90,000 threshold. Market analysts point to a confluence of favorable technical patterns and a dramatic spike in on-chain network activity as the primary drivers behind this latest leg up. As the digital asset reclaims key support levels, the broader financial community is closely monitoring whether this momentum can be sustained amid a stabilizing macroeconomic backdrop.
Technical Breakout and the Reclamation of Key Support Levels
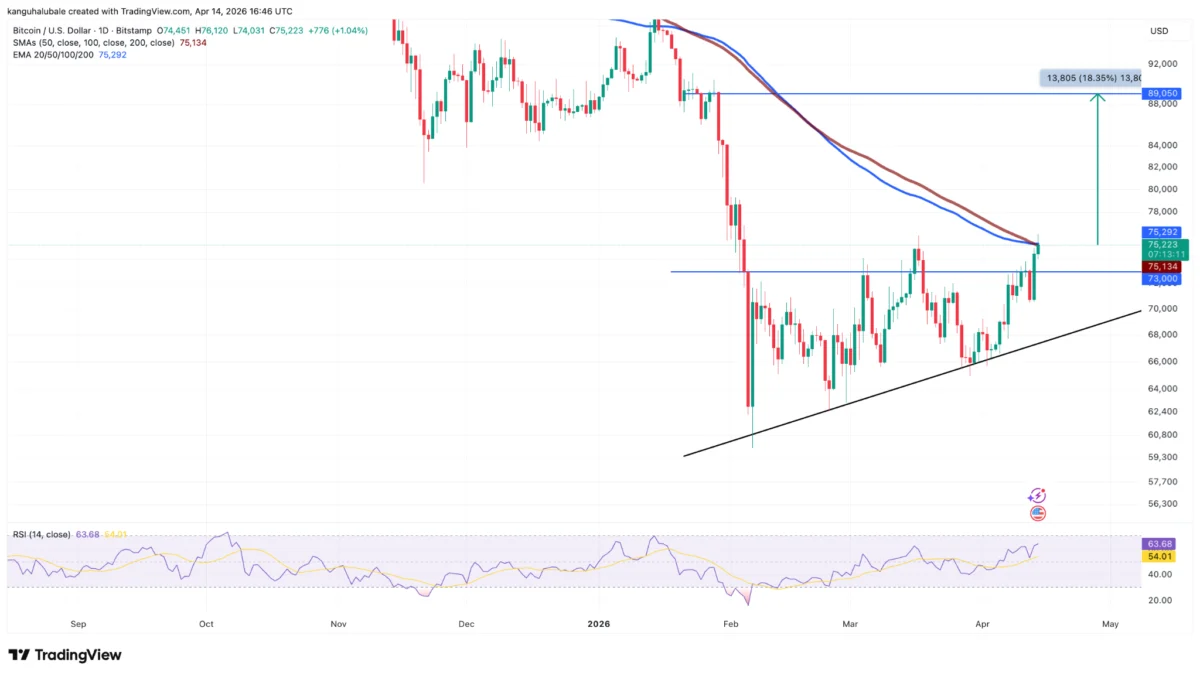
The recent price surge has effectively shifted the technical landscape for Bitcoin. According to data from TradingView, the BTC/USD pair successfully navigated through a dense thicket of resistance that had constrained price action for the better part of two months. Most notably, the rally allowed Bitcoin to reclaim the $75,000 zone, an area where the 100-day exponential moving average (EMA) and the 100-day simple moving average (SMA) converge. In technical analysis, the convergence of these two indicators often serves as a "line in the sand" for trend strength. By closing and maintaining levels above these averages, Bitcoin has signaled to institutional and retail traders alike that the medium-term trend has shifted from consolidation to accumulation.
The breach of the $76,000 level is particularly significant as it surpasses the local highs established in March. This move has been characterized by analysts as a confirmation of a trend reversal. When an asset breaks above its previous swing high following a period of correction, it often triggers algorithmic buying and a reduction in short-selling activity. The next major psychological barrier is identified at $80,000, but technical formations suggest the potential for even loftier targets.

Traders are currently focused on an ascending triangle pattern that has been forming on the daily charts. This bullish continuation pattern was validated when Bitcoin broke above the upper trend line at $73,000 earlier in the week. By applying the "measured move" principle—calculating the height of the triangle at its widest point and projecting it upward from the breakout point—analysts have identified a target of approximately $89,050. This would represent an 18% gain from current levels, placing the asset within striking distance of the prestigious $90,000 mark.
A Chronology of the Recent Recovery
The path to $76,000 has been marked by a steady recovery from deep oversold conditions. To understand the significance of the current rally, one must look back to early February 2026. On February 6, Bitcoin’s daily Relative Strength Index (RSI)—a momentum oscillator that measures the speed and change of price movements—plummeted to a reading of 15. In the world of technical analysis, any RSI reading below 30 is considered oversold, and a reading of 15 suggests extreme exhaustion among sellers.
Following that February low, Bitcoin entered a period of protracted consolidation, characterized by lower volatility and a gradual build-up of support. During this time, the network saw a quiet but steady increase in adoption, even as the price remained range-bound. By early April, the momentum began to shift. On April 5, the network recorded a massive spike in transaction volume, reaching 765,130 transactions in a single day. This surge in activity served as a leading indicator, suggesting that market participants were positioning themselves for a breakout long before the price moved above the $75,000 resistance.
The final catalyst for the Tuesday rally appeared to be macroeconomic in nature. Reports indicating that the U.S. Producer Price Index (PPI) inflation remained "tame" provided a favorable environment for risk-on assets. With inflation fears subsiding, capital began flowing back into the cryptocurrency market, pushing Bitcoin through its 70-day high and confirming the bullish thesis that had been building since the February lows.

On-Chain Metrics Signal Bull Market Behavior
While price action captures the headlines, the underlying health of the Bitcoin network provides the fundamental justification for the rally. On-chain data reveals that Bitcoin’s daily transaction count has risen by 62% since the start of 2026. The current level of activity is reminiscent of November 2024, a period defined by intense market euphoria following the U.S. Presidential Election, which eventually propelled Bitcoin above the $100,000 milestone for the first time in history.
The fact that transaction counts are currently higher than they were when Bitcoin was trading at $120,000 is a point of intense interest for analysts. High transaction volume during a price recovery typically indicates "organic" demand, meaning the move is supported by actual utility and movement of funds rather than mere speculative trading on centralized exchanges. This is often viewed as a hallmark of a healthy bull market.
Furthermore, Bitcoin’s total fee volume has seen a 4% increase over the past week, reaching approximately $153,700. While this may seem like a burden to users, in the context of network health, rising fees indicate heightened demand for block space. According to reports from Glassnode, this uptick suggests a "shift in user willingness to pay for transaction priority." When users are willing to pay more to ensure their transactions are processed quickly, it typically reflects a sense of urgency and confidence in the asset’s future value. This competition for block space is a vital component of Bitcoin’s security model and a reliable proxy for overall network engagement.
Expert Analysis and Market Reactions
The cryptocurrency community has reacted with cautious optimism to the latest price developments. Independent analysts and institutional research firms have highlighted the importance of the $76,000 close. Analyst CryptoBlockto noted in a recent briefing that clearing this resistance zone is the "confirmation" required to prove a sustained upside momentum. The sentiment is echoed by other market observers who point out that the 100-day moving average, which previously acted as a ceiling, is now likely to serve as a floor.

In a social media post that gained significant traction, analyst CryptOpus emphasized that Bitcoin is currently trading within a "horizontal supply zone." The successful breakout above this zone, combined with the support of the 100MA, creates a technical environment where the path of least resistance is upward. The consensus among these experts is that while volatility remains a factor, the structural integrity of the current rally is stronger than previous attempts to break higher earlier in the year.
Institutional sentiment also remains a critical factor. The stabilization of inflation data has allowed institutional investors to view Bitcoin as a viable component of a diversified portfolio once again. The "tame" PPI figures have reduced the likelihood of aggressive interest rate hikes, which generally create a headwind for non-yielding assets like Bitcoin. As long as the macroeconomic environment remains neutral to positive, the institutional "bid" is expected to remain under the market.
Broader Implications and Future Outlook
The implications of Bitcoin reaching $76,000 and eyeing $90,000 extend beyond the immediate gains for holders. A sustained rally in Bitcoin often acts as a tide that lifts all boats in the digital asset ecosystem. Historically, "Altseason"—a period where alternative cryptocurrencies outperform Bitcoin—frequently follows a significant Bitcoin breakout as profits are rotated into higher-risk assets.
However, the current market cycle appears to be more focused on Bitcoin’s role as "digital gold." With network activity at 17-month highs and transaction fees rising, the narrative is shifting back to Bitcoin’s fundamental value as a secure, decentralized ledger. If Bitcoin can successfully close a daily candlestick above the $80,000 psychological level, it would likely invalidate the remaining bearish arguments and clear the way for the $84,000 and $89,050 targets.

Investors are encouraged to remain mindful of the inherent risks. While the technical and on-chain data are overwhelmingly positive, the cryptocurrency market is known for its sudden reversals. The $75,000 level remains the most critical support to watch; a failure to hold this level could see the asset return to its previous consolidation range between $68,000 and $72,000.
In conclusion, Bitcoin’s 5% rally to $76,120 is more than just a price spike; it is a validation of the network’s growing utility and a signal of renewed investor confidence. With an ascending triangle pointing toward $90,000 and on-chain metrics mirroring the behavior of previous all-time high cycles, the stage is set for a potentially historic second quarter in 2026. As the network continues to process record numbers of transactions, the focus now shifts to whether the bulls can maintain their grip on the $76,000 handle and drive the market toward its next major milestone.