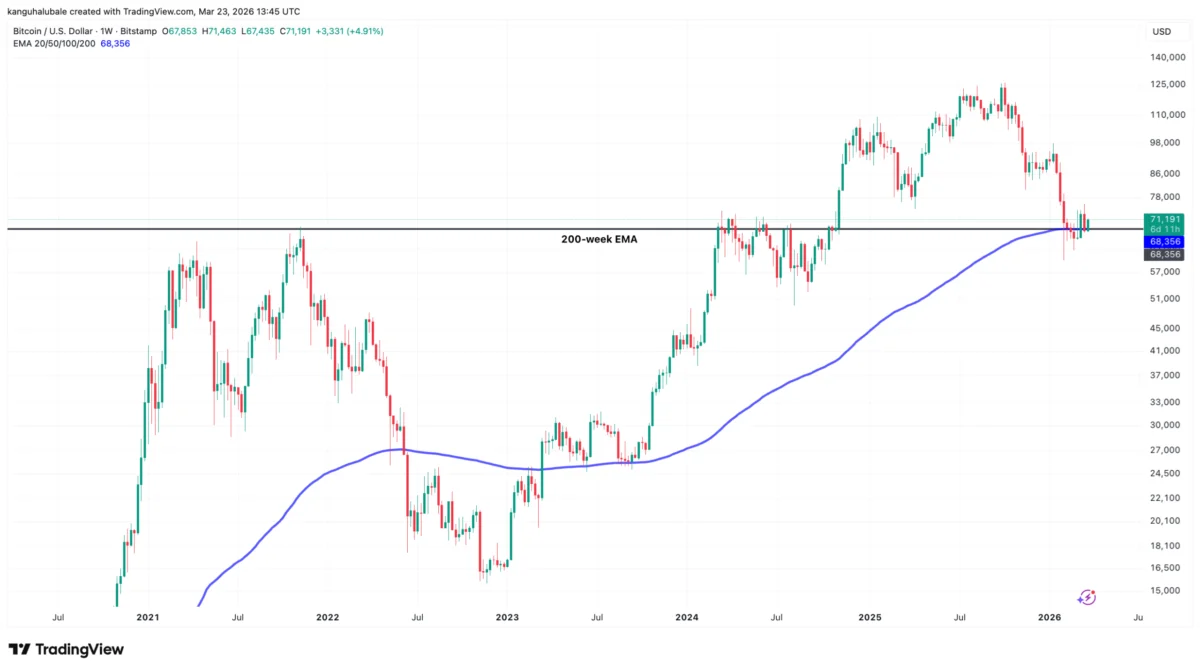
The global cryptocurrency market is currently navigating a period of heightened technical scrutiny as Bitcoin (BTC) struggles to maintain its upward momentum following a series of failed attempts to secure a decisive weekly close above key moving averages. Market analysts and technical researchers have identified a growing risk of a downward leg in the coming weeks or months, citing a failure to hold the 200-week exponential moving average (EMA) as a primary catalyst for potential bearish sentiment. As of late Monday, Bitcoin was trading at approximately $71,190, representing a modest 6% recovery from an intraday low of $67,300, yet the underlying technical structure remains precarious according to several prominent market observers.
The Significance of the 200-Week Exponential Moving Average
In technical analysis, the 200-week EMA is frequently regarded as a "line in the sand" for long-term market trends. For much of Bitcoin’s history, this indicator has served as a reliable floor during bear markets and a springboard during bull cycles. The current 200-week EMA sits at approximately $68,300. Sunday’s failure to close the week above this level has raised alarms among the trading community, with many suggesting that the recent relief rally to $76,000 may have been a "bull trap"—a false signal that attracts buyers before a significant price reversal.
The inability to sustain prices above $68,300 suggests that the liquidity required to push Bitcoin into a new discovery phase is currently lacking. Instead, the market is seeing evidence of consistent profit-taking. Every time the asset approaches or exceeds key accumulation zones, selling pressure from earlier entrants appears to cap the gains, leading to a "churning" price action that often precedes a deeper correction.
Chronology of Recent Price Movements and Market Volatility
To understand the current technical fragility, it is essential to trace the price action over the last several months. Following the launch of spot Bitcoin Exchange-Traded Funds (ETFs) in the United States in early 2024, Bitcoin experienced a surge in institutional interest, eventually pushing toward new all-time highs. However, the subsequent "halving" event in April led to a period of consolidation that has persisted into the second half of the year.

In early February, Bitcoin hit a range low of $59,930, a level that has since served as a psychological and technical anchor. By mid-March, a relief rally propelled the price back toward the $76,000 mark, fostering optimism among retail investors. This optimism was short-lived, however, as the asset broke down from a "rising wedge" pattern over a recent weekend. A rising wedge is typically viewed by chartists as a bearish reversal pattern, characterized by narrowing price fluctuations on upward-sloping trendlines.
The breakdown from this wedge coincided with a loss of the 50-day exponential moving average (EMA50), another critical short-to-medium-term indicator. Analysts note that when an asset loses both its short-term and long-term moving averages in rapid succession, the probability of a "waterfall" sell-off increases, as automated trading bots and stop-loss orders are triggered simultaneously.
Expert Analysis and Technical Price Targets
Several market analysts have voiced concerns regarding the immediate future of Bitcoin’s price trajectory. Analyst Jelle, a frequent commentator on market cycles, noted that the breakdown from the rising wedge has left "untapped lows" that appear ripe for a retest. Jelle pointed specifically to the liquidity gap between the local low of $65,500 and the February range low of $59,930. The theory suggests that markets often return to previous areas of high volume to "retest" the strength of buyers before moving higher.
Furthermore, Stockmoney Lizards, a technical analysis firm, highlighted the intersection of technical weakness and macroeconomic instability. They observed that the "global crisis" sentiment—fueled by geopolitical tensions and fluctuating inflation data—feels more insecure now than it did just two weeks ago. This external pressure, combined with the loss of the EMA50, suggests a revisit to the sub-$60,000 territory is not only possible but likely in the current regime.
Perhaps the most aggressive bearish target comes from analyst Michael J. Kramer, who identified a "bear flag" pattern on the daily charts. A bear flag consists of a sharp price drop (the flagpole) followed by a period of narrow, upward consolidation (the flag). When the price breaks below the flag, the "measured move" or target is often equal to the length of the flagpole. Based on this calculation, Kramer suggested that Bitcoin could be heading toward the mid-$40,000 range, specifically identifying $46,600 as a potential bottom.

On-Chain Data and Whale Cohort Realized Prices
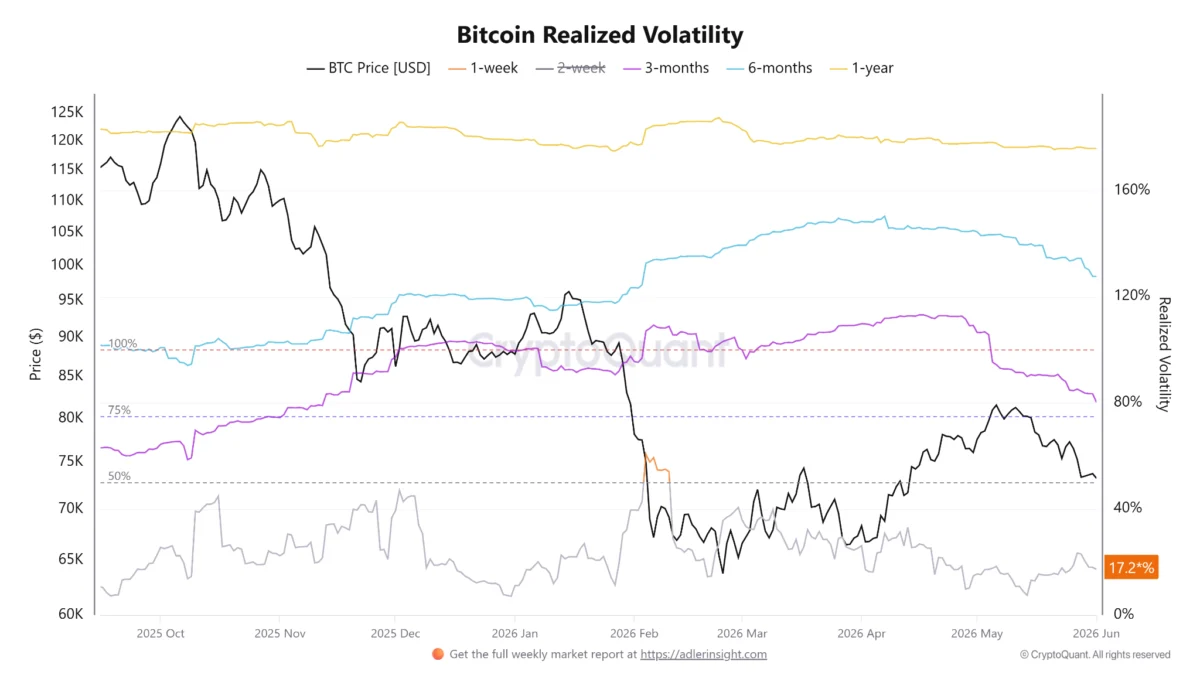
While chart patterns offer a visual representation of market psychology, on-chain data provides a look at the actual cost basis of various market participants. Data from CryptoQuant, analyzed by Axel Adler Jr., reveals a "deep structural" support level based on the realized price of different holder cohorts.
The "realized price" is the average price at which a specific group of coins last moved on the blockchain, essentially serving as the "break-even" point for that group. Currently, the largest holder cohort—those holding between 100 and 1,000 BTC—has a realized price that coincides almost exactly with the 200-week EMA at $68,300.
"As long as the price holds above $68,000, the largest cohort remains near its cost basis and maintains a more resilient position," Adler Jr. explained. However, he warned that a sustained move below this level would likely trigger a "nervous reaction" from these large holders, potentially leading to a wave of capitulation selling.
Interestingly, the next major structural threshold is significantly lower. The realized price for the 10-100 BTC holder cohort sits at approximately $46,700. This level aligns remarkably well with Michael J. Kramer’s technical target of $46,600. This confluence of technical patterns and on-chain data suggests that if the $60,000 support level fails, there is very little "on-chain" support until the mid-$40,000 range.
Prediction Markets and Long-Term Sentiment
The cautious outlook shared by technical analysts is being reflected in prediction markets, where traders bet on the likelihood of specific price outcomes. Recent data from major prediction platforms indicates that traders are pricing in a 70% chance that Bitcoin will drop below $55,000 at some point before 2026. Furthermore, the odds of a more severe crash below $45,000 are currently hovering around 46%.

These figures represent a significant shift in sentiment from the beginning of the year, when the prevailing narrative was one of "up only" following the ETF approvals. The shift suggests that the market is beginning to price in the "higher-for-longer" interest rate environment maintained by the U.S. Federal Reserve, which generally reduces the appetite for high-risk assets like cryptocurrencies.
Broader Impact and Market Implications
The potential for a 30% to 50% correction from recent highs would have far-reaching implications for the broader digital asset ecosystem. Bitcoin remains the "tide that lifts or lowers all boats"; a significant drop in BTC price typically results in even steeper losses for alternative cryptocurrencies (altcoins), which often possess less liquidity and higher volatility.
Furthermore, a drop to the $46,000 range would put many institutional buyers "underwater." Since the launch of spot ETFs, billions of dollars have flowed into Bitcoin at prices ranging from $40,000 to $70,000. If the price remains below the average entry point of these institutional products for an extended period, it could test the resolve of traditional finance investors and potentially slow the rate of institutional adoption.
From a structural perspective, a correction to $47,000 would represent a "healthy" retrace in the eyes of some long-term bulls. It would effectively wash out excessive leverage from the system and allow for a more sustainable accumulation phase. However, the path to that level would likely be marked by extreme volatility and a significant decline in retail sentiment.
Conclusion: A Market at a Crossroads
Bitcoin finds itself at a critical juncture. The convergence of a failed 200-week EMA close, a rising wedge breakdown, and a potential bear flag formation creates a formidable wall of resistance for bulls to overcome. While the current price of $71,190 shows signs of life, the "structural integrity" of the market appears dependent on holding the $68,000 level.

Investors and traders are now looking toward upcoming macroeconomic data releases—including Consumer Price Index (CPI) figures and Federal Reserve meeting minutes—for clues on the next major move. In the absence of a strong fundamental catalyst to the upside, the technical and on-chain evidence suggests that the "path of least resistance" may lead downward, with the mid-$40,000 range standing as the ultimate fortress of support for the current market cycle. As the market digests these signals, the coming weeks will likely determine whether the 2024 rally can be salvaged or if a deeper, multi-month correction is required to reset the stage for future growth.