The digital asset market entered the third week of March under significant duress as Bitcoin (BTC) struggled to maintain its footing amid a confluence of geopolitical instability, shifting macroeconomic policies, and technical breakdowns. Following a volatile weekend characterized by low liquidity and heightened price sensitivity, the world’s largest cryptocurrency by market capitalization slipped below critical support levels, prompting analysts to warn of a potential deeper correction toward the $50,000 psychological threshold. This downward pressure coincides with a historic slump in the gold market and a hawkish pivot from the United States Federal Reserve, creating a complex environment for risk assets globally.

Technical Breakdown and the Loss of the 200-Week Trend Line
Bitcoin’s price action over the weekend signaled a potential shift in medium-term momentum. Market data indicates that BTC dipped to approximately $67,400 during the weekly close, effectively losing control of the 200-week exponential moving average (EMA). Historically, the 200-week EMA has served as a "line in the sand" for bullish sentiment; staying above this level—currently situated near $68,300—is often viewed by technical analysts as essential for maintaining a long-term uptrend.
The failure to reclaim this level has introduced a period of uncertainty. Traders and analysts, such as the pseudonymous commentator CrypNuevo, suggest that the market may remain range-bound for the coming month, heavily influenced by external geopolitical developments. Short-term analysis points toward a potential price rotation to $65,000, with some market participants eyeing a "short squeeze" if price can reclaim $71,000. However, the immediate outlook remains cautious as liquidations continue to mount. According to data from CoinGlass, over $400 million in long and short positions were erased within a 24-hour window, reflecting the high-leverage environment currently dominating the space.

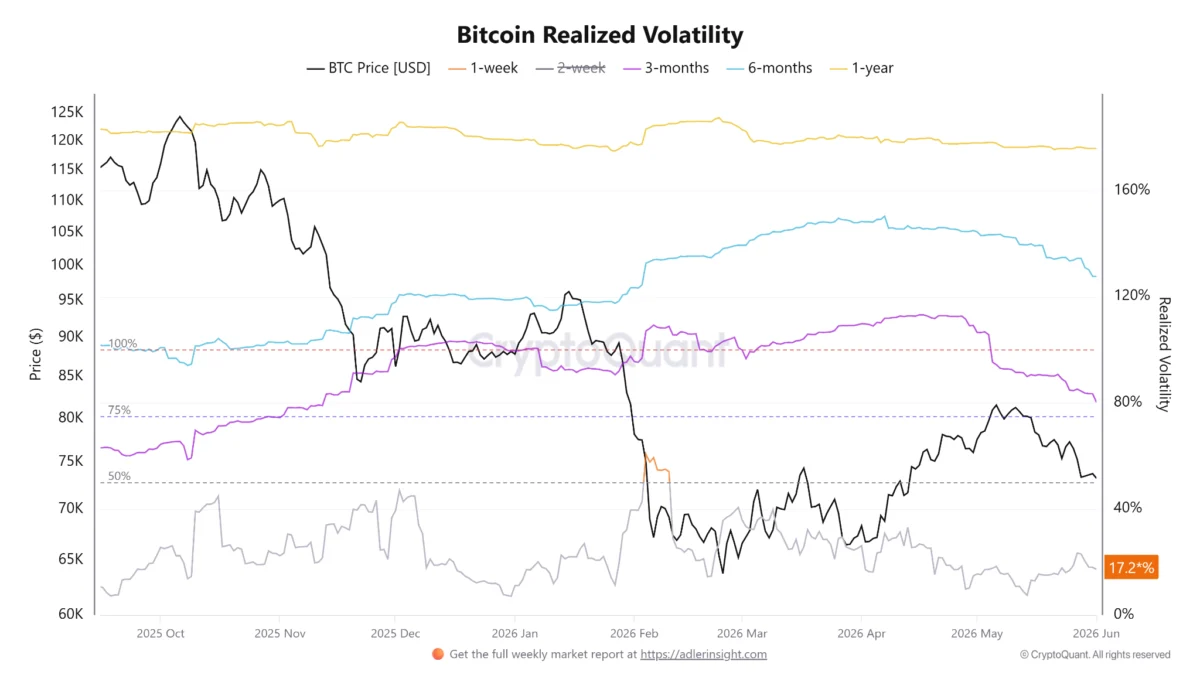
On-chain analytics platform CryptoQuant noted that weekend volatility is often exacerbated by the absence of institutional traders and the pause in spot-driven demand, particularly from Bitcoin exchange-traded funds (ETFs). This "weekend distortion" allows thinner order books to be moved by relatively small sell orders, triggering cascading stop-loss activations.
The Specter of the January Bear Flag Repetition
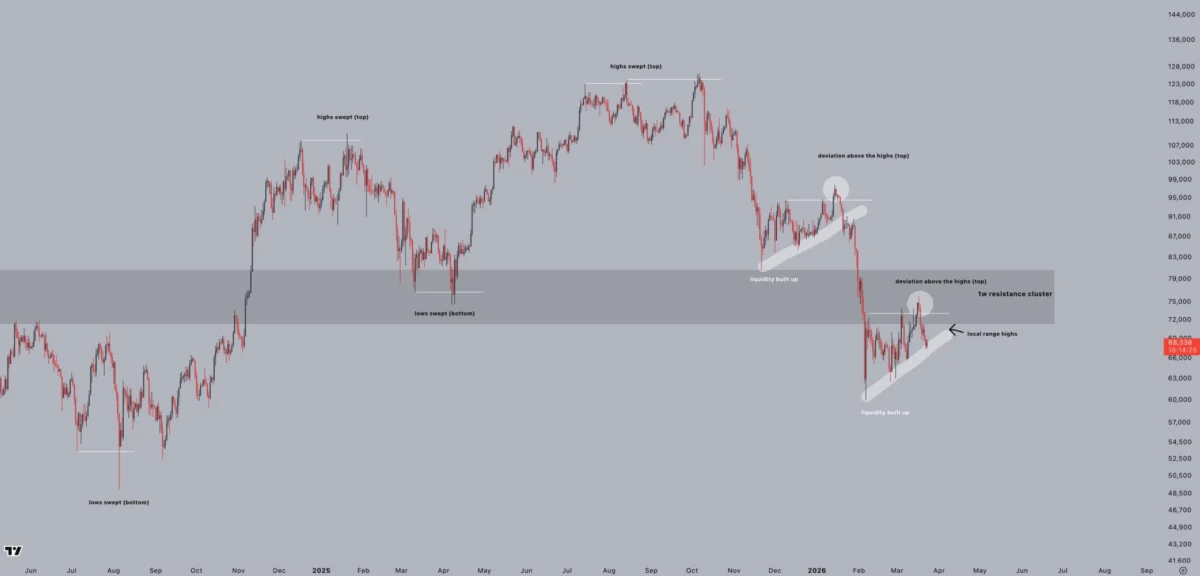
A primary concern for market strategists is the emergence of a "bear flag" pattern on the daily Bitcoin charts, which bears a striking resemblance to the price action observed in January. A bear flag is a technical continuation pattern that occurs after a sharp price drop (the flagpole), followed by a brief period of upward-sloping consolidation (the flag), which eventually breaks down to continue the original downtrend.

In January, Bitcoin experienced a similar breakdown after a period of relief. Current observations suggest that the recent rally to six-week highs of $76,000 may have been a "bull trap" within a larger macro downtrend. Trader Roman observed that the upward move was accompanied by low volume, a classic indicator of a weak trend reversal. If the current support levels near $66,000 fail to hold, the "measured move" for this technical pattern could project a target well below $50,000.
Keith Alan, co-founder of Material Indicators, reinforced this bearish outlook, suggesting that the technical setup aligns with a broader correction. The sentiment among seasoned traders suggests that while the $60,000 level remains a major psychological floor, the lack of aggressive buying at the current range could leave the "untapped lows" vulnerable to a retest.

Global Macro Crisis: Gold Enters Bear Market as Oil Surges
The cryptocurrency market is not acting in isolation; it is currently tethered to a deteriorating global macroeconomic landscape. Gold (XAU/USD), traditionally viewed as the ultimate safe-haven asset, has officially entered bear market territory after falling more than 20% from its all-time high. Prices recently touched local lows of $4,099 per ounce, a level not seen since late 2025.
The Kobeissi Letter, a prominent capital markets commentary, suggested that the erratic price movements in precious metals might indicate the liquidation of a major market participant or institutional fund. This "headline fatigue" and pockets of illiquidity are causing massive gaps in asset prices across the board. Simultaneously, the energy sector is facing a crisis centered on the Middle East. Tensions involving Iran have placed a spotlight on the Strait of Hormuz, a vital artery for global oil flows.

Crude oil prices have hovered near the $100 per barrel mark, creating significant inflationary concerns. Mosaic Asset Company noted that oil prices are directly correlated to headline inflation; a $10 increase per barrel can potentially push inflation readings higher by 0.20% or more. This resurgence of inflationary pressure complicates the Federal Reserve’s path toward interest rate cuts, as rising energy costs tend to bleed into the broader Consumer Price Index (CPI).
The Federal Reserve’s Hawkish Stance and PMI Outlook
The macroeconomic pressure is further compounded by a hawkish tone from the Federal Reserve. Following the most recent policy meeting, Fed Chair Jerome Powell emphasized that any loosening of monetary policy—specifically interest rate cuts—is contingent on "clear progress" regarding inflation. Despite signs of weakening in the U.S. labor market, which usually prompts a more dovish stance, the Fed has maintained its restrictive policy.

Market-implied odds, tracked by the CME FedWatch Tool, now suggest that rate cuts may not materialize for over a year. Some indicators even hint that further rate hikes could be on the table if inflation continues to inflect higher due to energy costs. This week, investors are closely monitoring the S&P Flash Purchasing Managers Index (PMI) and jobless claims data. Bitcoin has shown increasing sensitivity to PMI releases, as these reports provide a snapshot of the health of the U.S. manufacturing and services sectors. A stronger-than-expected PMI could reinforce the Fed’s "higher-for-longer" interest rate strategy, further weighing on risk assets like Bitcoin.
However, some analysts see a silver lining in the recent "triple-witching" options expiry event, where approximately $5.7 trillion in options tied to U.S. stocks, indexes, and ETFs expired. This event typically releases a significant amount of capital back into the market, which could drive volatility but also provide the liquidity needed for a potential rebound in the S&P 500—an index with which Bitcoin has shown a growing positive correlation.

Long-Term Holders and the Signal of Capitulation
Perhaps the most telling data comes from the Bitcoin blockchain itself. The Spent Output Profit Ratio (SOPR) for Long-Term Holders (LTHs) recently dropped to 0.64. This metric indicates that investors who have held Bitcoin for more than 155 days are currently selling their coins at an aggregate loss of 36% relative to their purchase price.
Historically, LTH capitulation is a sign of genuine market fear and often occurs near local or macro bottoms. When even the most "patient" hands begin to sell at a loss, it suggests a cleansing of the market’s speculative excess. CryptoQuant contributors noted that while one cohort of long-term holders is capitulating, another separate group appears to be "quietly absorbing" the supply. This is evidenced by a steady trend of BTC leaving centralized exchanges, suggesting a transition from weak hands to long-term accumulators.

Timeline of Recent Market Events
To understand the current market position, a look at the timeline of the past month is necessary:
- Late February: Bitcoin sees a swing low sub-$60,000 amid initial geopolitical jitters.
- Early March: A brief relief rally pushes BTC toward $76,000, but volume remains thin, leading to "bull trap" warnings.
- March 11: The LTH-SOPR hits 0.64, signaling the deepest level of long-term holder capitulation in over a year.
- Mid-March: The Federal Reserve holds interest rates steady but adopts a hawkish tone, citing energy-driven inflation risks.
- The Past Weekend: BTC loses the 200-week EMA support; Gold enters an official bear market; Oil fluctuates near $100.
Broader Impact and Market Implications
The current state of the market reflects a transition phase where Bitcoin is being tested not just as a speculative asset, but as a macro hedge. The simultaneous decline in gold and Bitcoin suggests that the current sell-off is driven more by a broad "dash for cash" and liquidity requirements than by a specific failure of the digital asset’s underlying value proposition.

If the bear flag pattern completes its breakdown, the market may brace for a retest of the $48,000 to $52,000 range. Such a move would likely flush out remaining high-leverage positions and provide a more stable foundation for future growth. Conversely, if Bitcoin can decouple from the downward trend in precious metals and reclaim the $70,000 level, it would signal a significant victory for bulls and a validation of the "accumulation" trend seen in exchange outflow data.
As the week progresses, the interaction between geopolitical headlines from the Middle East and U.S. economic data will remain the primary driver of price action. For now, the market remains in a defensive posture, waiting for a catalyst to either confirm the breakdown or spark a meaningful recovery. Investors are advised to maintain caution, as the combination of high volatility, geopolitical uncertainty, and hawkish central bank policy creates an environment where traditional technical supports may prove unreliable.