admin
admin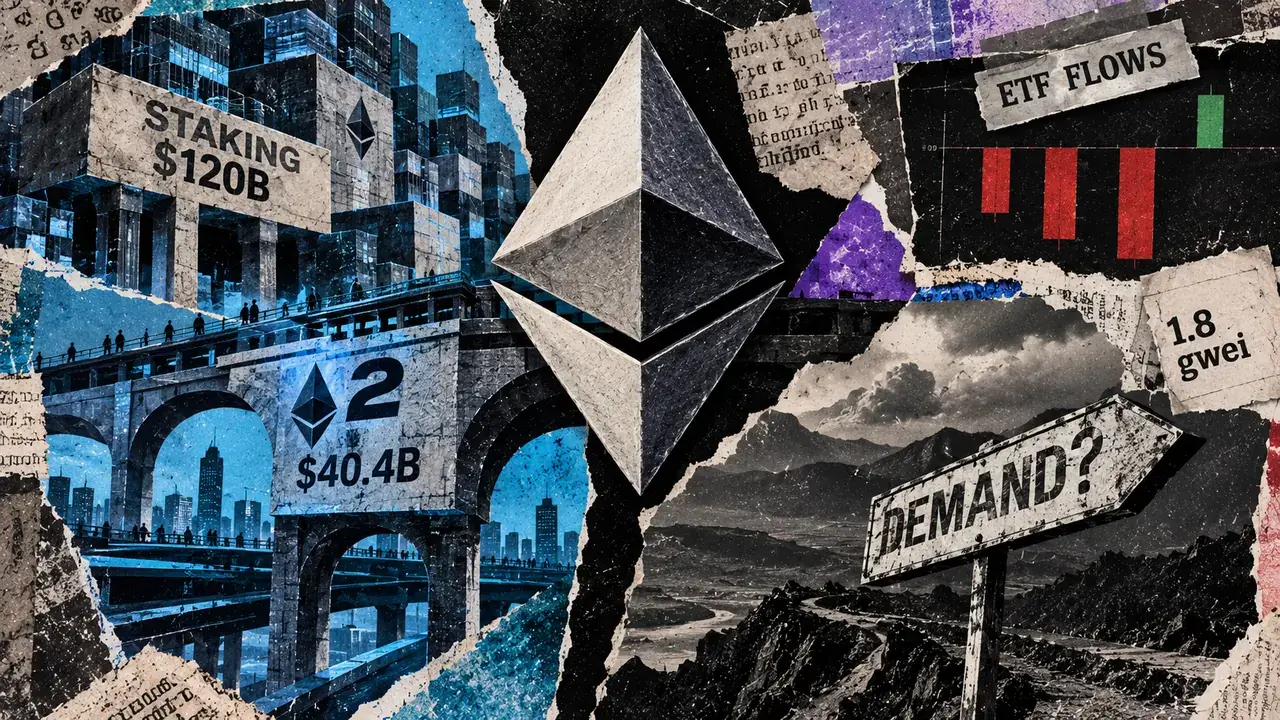
A recent snapshot of Ethereum’s institutional data, taken on September 21st, revealed approximately $120 billion in staked ETH and $40.4 billion in daily average total value locked (TVL) across Layer-2 (L2) networks. While these figures represent significant commitments to the Ethereum ecosystem, they measure distinct aspects and should not be conflated as a single indicator of fresh ETH demand. This nuance becomes particularly relevant as US-traded Ethereum Exchange-Traded Funds (ETFs) experienced net outflows totaling over $140 million between September 15th and 18th, highlighting that substantial ecosystem participation can coexist with investor withdrawals from specific investment vehicles.
Understanding Staked ETH: A Commitment to Security, Not Necessarily New Capital
The $120 billion figure for staked ETH represents the value of Ether locked to activate validators, the crucial nodes that secure the Ethereum network and, in return, earn rewards for their operators. This process, known as staking, is fundamental to Ethereum’s proof-of-stake consensus mechanism, which replaced its energy-intensive proof-of-work system in September 2022 with "The Merge."
However, it is critical to understand that a staking balance does not inherently signify new capital entering the Ethereum market. An individual or entity might stake ETH they already possess, perhaps acquired previously. In such cases, staking represents a reallocation of existing holdings to participate in network security and generate passive income, rather than a fresh purchase of ETH driven by increased demand. Conversely, an investor might purchase ETH specifically with the intention of staking it. Therefore, the dollar value of staked ETH reflects both the quantity of Ether committed and its prevailing market price, not solely the amount of new capital injected into the ecosystem during a specific period.
The advent of liquid staking protocols has further complicated this picture. These protocols, such as Lido Finance, allow users to stake their ETH and receive liquid staking tokens (e.g., stETH) in return. These tokens represent the underlying staked ETH and can be traded on secondary markets, offering holders a degree of liquidity. While the underlying ETH remains committed to network validation, the holder retains the ability to participate in DeFi activities or exit their position without unstaking their ETH directly. This introduces another layer of abstraction, where the token value might fluctuate independently of the staked ETH’s underlying value and does not directly correlate with new ETH acquisition.
For investors and analysts seeking to gauge genuine ETH demand, the performance of investment channels like Ethereum ETFs offers a more direct, albeit partial, view. Data from Farside Investors’ Ethereum ETF table provides a chronological record of capital flows into these regulated investment products. In the week leading up to September 18th, US-traded spot Ethereum ETFs saw a mixed performance. They began the week of September 14th with inflows of $121.1 million, followed by significant outflows of $405.4 million from September 14th to September 17th. The week concluded on September 18th with a rebound, showing fresh inflows of $143.7 million. These ETF flows, while informative about investor sentiment towards these specific products, also represent only one avenue of ETH acquisition and do not encompass all forms of demand, such as direct purchases on exchanges or within decentralized applications.
Layer-2 Networks: Scaling Solutions and Their Economic Footprint
The $40.4 billion figure for Total Value Locked (TVL) on Ethereum’s Layer-2 (L2) networks represents the assets held within these scaling solutions. L2s are designed to process transactions off the main Ethereum blockchain, thereby reducing congestion and lowering transaction fees for users. Prominent L2s include Arbitrum, Optimism, Polygon (which operates in a hybrid L2/sidechain model), and zkSync. The TVL on these networks includes various assets deposited by users, such as stablecoins, Ether, and other cryptocurrencies, used for DeFi applications, trading, and other services built on these faster, cheaper networks.
While a high TVL indicates significant economic activity and user adoption on L2s, it is crucial to distinguish this from ETH demand. The connection between L2 activity and ETH holders primarily stems from the fees these L2 networks pay to the Ethereum mainnet for security and data availability. Operators of L2 solutions must periodically "settle" transactions and post data on the Ethereum mainnet. This process incurs costs, which are paid in ETH.
L2BEAT, a widely recognized analytics platform, tracks these on-chain costs, categorizing them into components such as calldata, blobs, compute, and overhead. Calldata and blobs, in particular, represent the data that L2 operators must publish on the Ethereum mainnet to ensure the integrity and verifiability of their off-chain transactions. The costs associated with these operations are directly tied to Ethereum’s gas fees.
However, the total operator spending on L2 settlement does not equate directly to ETH burned. Ethereum’s fee mechanism, particularly after the EIP-1559 upgrade, separates transaction fees into two components: the base fee, which is burned (removed from circulation), and the priority fee, which is paid to validators as an incentive. More recently, with the introduction of EIP-4844 (Proto-Danksharding), a new fee market for "blobs" was created. Blob fees, which are essential for L2 data availability, are also burned.
This distinction is vital because it prevents a simplistic assumption that rising L2 activity automatically translates into proportional benefits for all ETH holders. The assets held on L2s are distinct from the ETH used to pay for settlement services. Furthermore, the fees charged to L2 users are not directly equivalent to the fees paid to the Ethereum mainnet. The amount of ETH burned depends on the total gas consumed by L2 settlement transactions and the applicable base and blob fees.
Ultrasound.money, a popular tracker of Ethereum’s fee market and ETH burn rate, showed a gas header of 1.8 gwei on September 21st. Lower execution base fees generally indicate reduced transaction costs for users and can be a sign of successful scaling initiatives making the network more efficient. When base fees are low, less ETH is burned per unit of gas consumed, assuming constant gas usage. Conversely, high gas prices lead to a more significant ETH burn. The net change in ETH supply is a function of both this burning mechanism and the issuance of new ETH to validators as staking rewards.
Interplay of Staking, Settlement, and Demand
In essence, staked ETH plays a role in securing the network, contributing to its decentralization and resilience. Meanwhile, the use of L2s and their subsequent settlement on Ethereum’s mainnet involves ETH in its function as a medium of exchange for paying for essential network services.
The question of whether these ecosystem activities translate into sustained additional ETH purchases or a net reduction in ETH supply hinges on the interplay between acquisition flows and fee dynamics over time. The substantial figures for staked ETH and L2 TVL provide a starting point for assessing the ecosystem’s scale and the diverse ways ETH is utilized. However, a comprehensive understanding of ETH demand requires looking beyond these aggregate metrics to analyze the underlying drivers of ETH acquisition and the evolving fee market.
The coexistence of a large staked ETH balance and significant L2 TVL with outflows from Ethereum ETFs underscores the complexity of the cryptocurrency market. Investors may be strategically reallocating capital, moving funds between different investment vehicles or asset classes, while the underlying network infrastructure continues to grow and evolve. The Ethereum ecosystem, with its multi-faceted utility and expanding scaling solutions, presents a dynamic landscape where various forces shape both its utility and its economic value. Analyzing these distinct components—staking, L2 activity, and direct investment flows—provides a more accurate and nuanced picture of the current state and future trajectory of the second-largest cryptocurrency by market capitalization.