Solana (SOL) is currently navigating a pivotal juncture in its price trajectory, a moment where the preservation of a critical support zone between $78 and $82 will likely dictate whether the cryptocurrency embarks on a significant expansion phase or succumbs to a deeper corrective downturn. Following several weeks of volatile, range-bound trading and thwarted breakout attempts, the market has lost its discernible trend, entering a period of compression. In the volatile cryptocurrency landscape, such periods of consolidation are typically precursors to substantial price movements.
The integrity of the $78-$82 support band is paramount. Holding this level is essential for maintaining Solana’s established long-term bullish structure. A breach below this threshold, however, would fundamentally alter the market narrative, shifting focus towards increased downside risk and potential further depreciation. This critical juncture is further amplified by the stark contrast between currently weak short-term technical signals and a still-promising macro-economic and network development outlook for Solana.
A Recent Rejection That Shifted Market Sentiment
Solana’s recent attempt to breach the resistance zone between $87 and $89 initially appeared to signal the commencement of a bullish breakout. However, this upward momentum proved unsustainable, resulting in a swift and decisive rejection. The price failed to maintain its elevated levels, rotating lower and indicating insufficient buying pressure to sustain the advance. The observed price action lacked the characteristic acceleration and follow-through typically associated with genuine breakouts, instead presenting as a gradual upward push followed by a rapid sell-off.
From a technical analysis perspective, this rejection is significant. It suggests that the recent rally was likely corrective in nature rather than impulsive, a crucial distinction for market participants. In robust bullish trends, price action usually exhibits clear and aggressive wave patterns. The current hesitant structure, however, leaves the door open for further downward price discovery. Consequently, market attention has recalibrated from resistance levels to the more pressing concern of the aforementioned support zone.
[Insert Image: Solana 24H price chart (Source: CoinMarketCap)]
Solana 24H price chart (Source: CoinMarketCap)

The $78-$82 Zone: A Definitive Line in the Sand
While appearing narrow, the current trading range holds outsized significance. The $78-$82 region is not merely another support level; it represents the foundational base of Solana’s recent price structure. This zone encapsulates several key technical and psychological factors:
- Previous Accumulation Area: This price band has historically served as a zone where astute investors and market makers accumulated SOL, indicating underlying demand.
- Psychological Support: Breaking below $80 can trigger fear and capitulation, potentially leading to a cascade of sell orders.
- Technical Confluence: The zone aligns with significant moving averages and trendlines on various timeframes, reinforcing its importance as a support area.
As long as Solana’s price remains above this critical threshold, its broader structural outlook remains constructive, allowing for the potential formation of higher lows and the gradual build-up of pressure for a future breakout. However, a decisive break below this zone would immediately signal a shift in momentum and sentiment, potentially opening the path towards lower price targets in the $70-$75 range. This level, therefore, is not a passive indicator but a critical decision point for the cryptocurrency’s immediate future.
[Insert Image: Solana rejection near $87.87 keeps focus on $78.76 to $81.65 support]
Solana rejection near $87.87 keeps focus on $78.76 to $81.65 support
Compression as a Harbinger of Significant Price Movement
Despite the recent price weakness, Solana is not exhibiting signs of a complete collapse; rather, it is undergoing a period of tightening price action. The cryptocurrency has been consolidating sideways within a compressed range, roughly between $80 and $90. This period is characterized by decreased volatility and progressively smaller price swings, suggesting that the market is coiling, much like a spring, in anticipation of a larger move.
This phase of compression often precedes significant expansion. It represents the calm before a storm, where liquidity builds, market positions are accumulated or liquidated, and underlying pressure increases until the market is compelled to resolve its direction. The critical takeaway is not merely that a substantial price movement is imminent, but that such a move, when it occurs, is likely to be sharp and decisive.
A Subtle Transition Towards Accumulation
Beneath the surface of choppy price action, subtle indicators suggest a potential shift from distribution to accumulation. Following a notable decline towards the $70 area earlier in the current market cycle, Solana has been establishing a more stable price base. This stabilization has been accompanied by:

- Decreasing Selling Volume: As price consolidates, the volume of selling pressure appears to be diminishing, indicating that sellers are becoming less aggressive.
- Increasing Buying Volume on Dips: While not yet consistent, there are observed instances where dips within the range are met with increasing buying interest, absorbing selling pressure.
- Broader Consolidation Pattern: The formation of a wider consolidation pattern suggests that the market is absorbing previous selling pressure and potentially building a foundation for future gains.
While these observations do not definitively confirm a bullish trend reversal, they strongly suggest that sellers are gradually losing control of the market narrative. Historically, markets rarely reverse instantaneously; stabilization typically precedes a sustained recovery. Solana appears to be in this crucial stabilization phase, building the groundwork for a potential upward move.
The Long-Term Macro Structure: Foundation for Significant Upside
When viewed on higher timeframes, Solana’s price chart presents a significantly different picture. The cryptocurrency continues to trade above a steadily rising trendline that has provided crucial support since late 2023. Concurrently, it remains constrained by a descending resistance line, forming a large, contracting structure on the chart.
This configuration is a classic macro pattern, indicative of compression between ascending support and descending resistance. If, and this is a critical condition, the rising support trendline continues to hold, the eventual breakout from this overarching structure could be substantial. Technical projections derived from this pattern suggest the potential for significant price appreciation:
- Target Price Projections: Based on the measured move of this broadening pattern, potential upside targets could reach between $300 and $400.
- Cyclical Potential: Such a move would represent a significant percentage increase, potentially marking a new all-time high for Solana and indicating a strong continuation of its growth cycle.
From current trading levels, this scenario represents a potential upside of approximately 300% to 400%. While this projection is not a guarantee, it is a structurally valid possibility based on established chart patterns.
[Insert Image: SOL/USD 1 Day Chart. (Source: Don on X)]
SOL/USD 1 Day Chart. (Source: Don on X)
Confirmation Remains Essential for Sustainable Rallies
Notwithstanding the optimistic long-term potential, the market has not yet reached that advanced stage. Before any sustained rally can commence, Solana must demonstrate strength in several key areas:

- Sustained Hold of $78-$82 Support: The immediate priority is the successful defense of this critical support zone. A firm bounce and subsequent upward movement from this level would be the first sign of renewed buyer conviction.
- Breakout Above Short-Term Resistance: A decisive breach of the recent resistance around $87-$89, accompanied by strong volume, would signal a shift in short-term momentum.
- Confirmation of Higher Lows: Establishing a series of higher lows on the chart would confirm that buyers are regaining control and are willing to pay higher prices for SOL.
Until these confirmations are achieved, the market is likely to remain in a neutral phase, with a slightly bullish bias but without definitive confirmation of an upward trend. This distinction is vital, as many potential rallies falter not due to a flawed initial setup but because the necessary confirmation signals fail to materialize.
Underlying Fundamentals Show Quiet Strength
While price action remains uncertain, Solana’s fundamental network infrastructure and ecosystem development continue to exhibit quiet strengthening. Key advancements include:
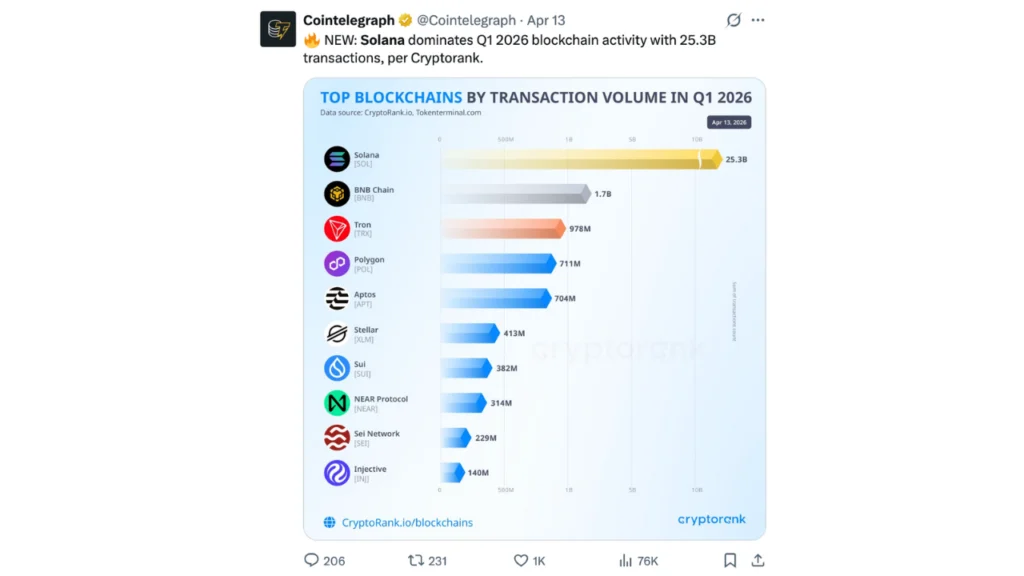
- Increased Transaction Throughput: Solana continues to demonstrate its capacity for high transaction volumes, consistently processing billions of transactions. For instance, reports indicate Solana handled over 25.3 billion transactions in Q1 2026, solidifying its position as a leading blockchain in terms of activity.
- Growing Developer Activity: The number of active developers on the Solana network has seen a consistent increase, indicating ongoing innovation and the development of new applications and services.
- Ecosystem Expansion: The launch of new decentralized applications (dApps), stablecoins, and DeFi protocols on Solana further diversifies its utility and attractiveness to users and investors.
- Improved Network Stability: Following past challenges, significant upgrades and optimizations have enhanced Solana’s network stability and reliability, addressing previous concerns.
This divergence between consolidating price action and strengthening fundamentals creates an interesting dynamic. Historically, such discrepancies can lead to delayed but ultimately powerful repricing events once market momentum returns. While not a direct catalyst for an immediate rally, these fundamental improvements are building the necessary conditions for one.
[Insert Image: Solana dominates Q1 2026 blockchain activity with 25.3B transactions (Source: Cryptorank)]
Solana dominates Q1 2026 blockchain activity with 25.3B transactions (Source: Cryptorank)
Two Plausible Scenarios Hinge on a Single Decision Point
At this juncture, Solana’s price action is delicately balanced between two equally plausible outcomes, both of which pivot on the resolution of the current support test.
Bullish Scenario
Should Solana successfully defend the $78-$82 support zone and subsequently break through the $87-$89 resistance, the market could enter a powerful expansion phase. This would likely involve:

- Rapid Price Appreciation: A decisive breakout could trigger significant buying interest, leading to a swift ascent towards higher price targets.
- Re-establishment of Bullish Momentum: The successful defense of support and breach of resistance would confirm the long-term bullish structure and reinvigorate investor confidence.
- Acceleration towards Macro Targets: This scenario would put the $300-$400 upside potential, derived from the longer-term chart pattern, back into play.
Bearish Scenario
Conversely, a failure to hold the $78-$82 support zone would signal a bearish shift, potentially leading to:
- Increased Downside Pressure: A break below this critical support could trigger panic selling, accelerating the price decline.
- Re-evaluation of Long-Term Structure: The loss of this key support would necessitate a re-evaluation of Solana’s bullish narrative and could invalidate the longer-term upside projections.
- Extended Correction: The market might enter a deeper correction, with price potentially testing lower support levels in the $70-$75 range, and possibly even lower, before finding a stable base.
Both scenarios remain technically valid at this point, and neither has been definitively confirmed. This uncertainty underscores the critical importance of the current moment.
Final Assessment: A Market Poised for Resolution
Solana is currently in a state of preparation rather than active trending. Short-term technical signals continue to reflect market hesitation, characterized by failed resistance attempts, weak momentum, and a lack of clear breakout structure. However, the broader macro setup remains intact, and the substantial long-term potential has not dissipated.
The immediate future of Solana’s price action hinges entirely on the resolution of the critical $78-$82 support zone. A successful defense of this level would position Solana for a significant upward move, potentially redefining its trajectory for the current market cycle. Conversely, a failure to hold this support would likely necessitate further consolidation and a longer period before any meaningful rally can commence. The ambitious 300%-400% upside scenario is not mere speculation but a structurally derived possibility. However, before this potential can be realized, Solana must first navigate and pass its most significant test to date.