The cryptocurrency market is currently witnessing a significant surge in optimism surrounding Bitcoin (BTC), with leading analysts and technical indicators suggesting a potential ascent towards the $80,000 mark by the end of March. This bullish outlook follows a period of consolidation and a decisive move by Bitcoin’s price to invalidate previously bearish chart patterns, signaling renewed upside momentum driven by a confluence of technical strength, institutional interest, and shifting investor sentiment. The recent price action, particularly a notable jump to nearly $72,000, has ignited expectations among traders and analysts, who are now closely monitoring key resistance levels and market dynamics.
Chronology of Recent Price Action and Pattern Invalidation
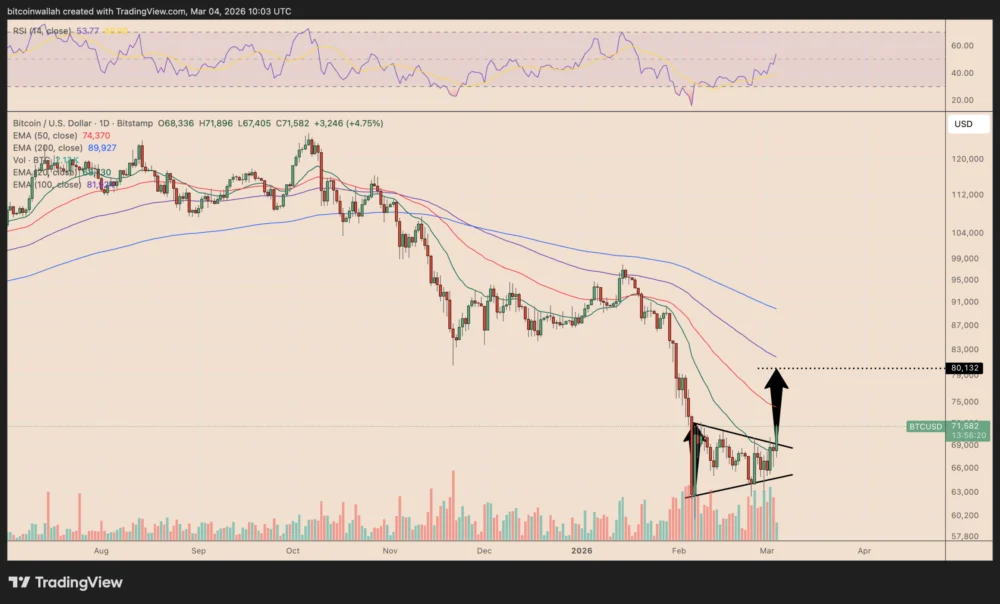
The current bullish narrative began to solidify on Wednesday when Bitcoin’s price exhibited a critical technical development. What initially appeared to be a bear pennant formation – typically a continuation pattern indicating further downside after a sharp drop – was decisively invalidated. A bear pennant forms after a significant downward price movement, where price consolidates within a contracting symmetrical triangle before usually breaking down further. However, in this instance, the BTC/USD pair pierced the upper trend line of the pennant, indicating a strong rejection of the bearish thesis. This breakout was not merely a fleeting movement; it was accompanied by a discernible rise in trading volume, lending credence to the strength and conviction behind the rally. The 5.21% jump pushed Bitcoin to approximately $71,900, a level that significantly altered the immediate technical landscape and set the stage for the current upward trajectory.
This invalidation of the bear pennant simultaneously increased the probability of a symmetrical-triangle bullish reversal pattern forming. A symmetrical triangle is a neutral pattern where price makes lower highs and higher lows, compressing into a tightening range. The direction of the subsequent breakout determines the future trend. When the price breaks above the upper trendline with conviction, it signals a bullish reversal, and the measured move target is typically calculated by adding the pattern’s maximum height to the breakout point. In Bitcoin’s recent case, the triangle’s widest range has been observed between approximately $63,000 and $71,000-$72,000. A standard measured move above the upper trend line from this formation points directly to a target of around $80,000 in March, provided the breakout sustains. This target also strategically aligns with Bitcoin’s 100-day exponential moving average (EMA), a key long-term resistance and support level often watched by institutional traders. The next immediate hurdle for Bitcoin, according to this analysis, lies near the 50-day EMA, currently around $74,400. A successful breach of this level would further reinforce the bullish momentum, while a rejection could lead to a temporary pullback towards the 20-day EMA, positioned around $68,700, offering a potential retest of support before another attempt at higher levels.

Supporting Data: Multiple Indicators Converge on $80,000
The target of $80,000 is not merely an arbitrary projection from a single technical pattern; it is reinforced by the convergence of at least three significant indicators, each contributing to a robust bullish case.
1. Symmetrical Triangle Bullish Reversal Pattern: As detailed above, the invalidation of the bear pennant has paved the way for a symmetrical triangle formation, which, upon its upside breakout, projects a measured move to approximately $80,000. This pattern’s reliability is rooted in its ability to signal a decisive shift in market control from sellers to buyers. The volume accompanying the breakout is crucial, as higher volume indicates stronger conviction and less likelihood of a false breakout. The current observation of increased volume alongside the breakout lends significant credibility to this technical projection.
2. Unfilled CME Futures Gap at $80,000: Another compelling factor drawing Bitcoin towards the $80,000 region is an unfilled gap in the CME Bitcoin futures market. CME gaps occur when the futures market, which operates on traditional trading hours, closes for the weekend, but the underlying spot Bitcoin market continues to trade. If the spot price moves significantly while futures are closed, the futures market reopens at a new level, leaving an "empty" price zone, or gap, on the chart. Historically, a substantial majority of these CME gaps tend to be filled as spot and futures prices eventually re-align. As of Wednesday, a notable CME gap has been observed between approximately $79,660 and $81,210, a zone that has remained unfilled since early February. The consistent tendency for these gaps to be filled, with nine out of the last ten CME gaps being closed since August 2025 (a historical pattern that traders closely observe), transforms this price range into a powerful "magnet zone" for bullish traders. The psychological and algorithmic pressures to fill these gaps often drive price action towards them, making the $80,000 level a highly probable target for market participants seeking price equilibrium.
3. Polymarket’s Shifting Prediction Market Odds: Beyond traditional technical analysis, sentiment indicators from prediction markets like Polymarket are also reflecting a clear bullish shift. Polymarket is a decentralized prediction market platform where users can trade contracts based on the outcomes of real-world events, including cryptocurrency price targets. These markets aggregate collective intelligence and reflect the crowd’s perceived probabilities. On Wednesday, Polymarket data revealed a significant increase in the odds of Bitcoin reaching $80,000 in March, climbing to 40% from just 20% a day prior. Even stronger conviction was observed for the $75,000 target, with odds surging to 70% from 40% in the same period. Conversely, the probabilities for Bitcoin’s price falling to $65,000 or $60,000 in March saw a notable reduction, suggesting that market participants are actively trimming their downside expectations and are increasingly confident in an upward trajectory. This shift in sentiment on a platform where real capital is at stake provides a tangible measure of evolving market expectations.

Broader Context and Market Dynamics
The current bullish momentum is not occurring in a vacuum. It is underpinned by several significant macroeconomic and industry-specific developments that provide crucial background context.
Institutional Adoption and Spot Bitcoin ETFs: The approval and subsequent launch of spot Bitcoin Exchange-Traded Funds (ETFs) in the United States in January 2024 have been a game-changer for the cryptocurrency market. These ETFs provide traditional investors with a regulated, accessible, and familiar vehicle to gain exposure to Bitcoin without directly owning the underlying asset. The consistent inflows into these ETFs, particularly from major players like BlackRock’s IBIT, have represented a sustained demand shock for Bitcoin, absorbing significant supply from the market. For instance, recent reports indicated that US spot Bitcoin ETFs added $225 million in inflows, with BlackRock’s IBIT effectively offsetting redemptions from other funds. This continuous institutional demand acts as a powerful fundamental driver, underpinning Bitcoin’s price appreciation and providing a solid foundation for further growth. The ease of access for large institutional capital through ETFs contrasts sharply with previous cycles, where retail interest predominantly drove price rallies.
The Upcoming Bitcoin Halving Event: Adding to the bullish fervor is the impending Bitcoin halving event, historically a catalyst for significant price rallies. The halving, expected in April 2024, will cut the reward for mining new blocks by half, thereby reducing the rate at which new Bitcoins enter circulation. This supply shock, coupled with sustained demand from ETFs and retail investors, is widely anticipated to create upward price pressure. Previous halving events have consistently preceded multi-month to multi-year bull markets, leading many analysts to believe that Bitcoin is currently in the early stages of another such cycle. The market tends to "price in" the halving event in the months leading up to it, and the current price movements could be indicative of this phenomenon.
Global Macroeconomic Environment: While Bitcoin is often seen as a hedge against inflation and a store of value independent of traditional financial systems, its price performance is not entirely decoupled from the global macroeconomic environment. Discussions around inflation rates, central bank monetary policies (particularly the Federal Reserve’s interest rate decisions), and the overall health of the global economy continue to influence investor appetite for risk assets, including cryptocurrencies. A pivot towards more accommodative monetary policies, such as interest rate cuts, could further boost liquidity in financial markets and encourage investment in higher-risk, higher-reward assets like Bitcoin. Conversely, persistent inflation or hawkish central bank stances could introduce headwinds, though the current narrative leans towards a more favorable macro backdrop for risk assets in the medium term.

Implications and Broader Impact
Should Bitcoin successfully reach and sustain the $80,000 level in March, the implications for the broader cryptocurrency market and investor sentiment would be profound.
Firstly, hitting $80,000 would establish a new all-time high, surpassing the previous peak of approximately $73,750 achieved earlier in March. This would serve as a powerful psychological milestone, signaling unprecedented strength and potentially attracting a fresh wave of capital from both institutional and retail investors who missed earlier entry points. The "fear of missing out" (FOMO) often intensifies once new all-time highs are established, leading to accelerated price discovery.
Secondly, a confirmed move above $80,000 would validate the strength of the current bull market cycle. It would reinforce the narrative that institutional adoption via ETFs, coupled with the supply shock from the halving, is fundamentally altering Bitcoin’s market dynamics. This could encourage further investment in the wider altcoin market, as Bitcoin’s dominance often sets the tone for the entire crypto ecosystem.
Thirdly, the sustained upward trajectory could solidify Bitcoin’s position as a legitimate asset class in the eyes of mainstream finance. As its market capitalization grows and its price stability improves (relative to its earlier volatility), more traditional financial institutions may consider allocating a portion of their portfolios to digital assets, further integrating cryptocurrencies into the global financial fabric.

However, it is crucial to acknowledge that the path to $80,000 is not without potential pitfalls. Technical analysis, while informative, is not infallible. Rejections at key resistance levels, such as the 50-day EMA near $74,400, could trigger pullbacks. Unexpected negative macroeconomic news, regulatory crackdowns, or significant whale selling could also disrupt the bullish momentum. The market remains inherently volatile, and while indicators point to strong upside potential, risk management remains paramount for all participants.
In conclusion, the confluence of a decisive invalidation of bearish chart patterns, the emergence of a symmetrical triangle projecting an $80,000 target, the magnetic pull of an unfilled CME futures gap, and the increasingly bullish sentiment reflected in prediction markets paints a compelling picture for Bitcoin’s short-term future. Bolstered by robust institutional demand through ETFs and the anticipation of the halving event, Bitcoin appears poised for further price discovery as it aims for the significant $80,000 milestone in March, signaling a vibrant and evolving landscape for digital assets.